Stand up for the facts!
Our only agenda is to publish the truth so you can be an informed participant in democracy.
We need your help.
I would like to contribute
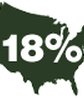
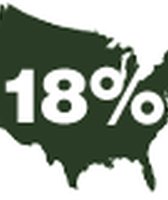
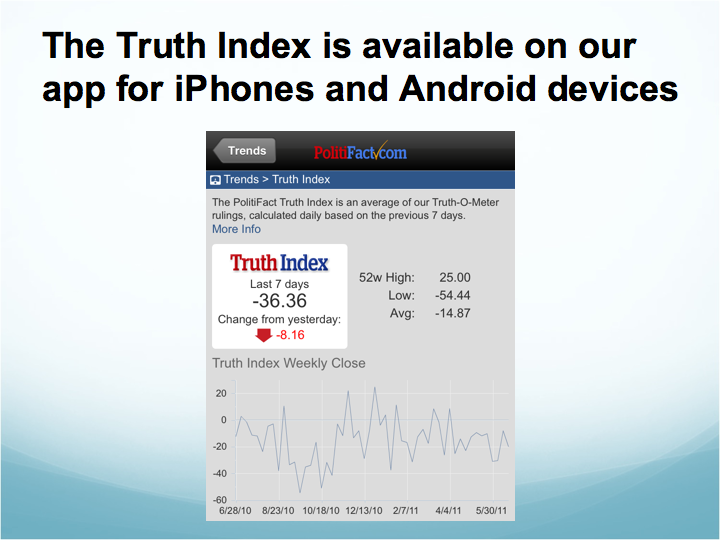
Our new Truth Index (shown here from last Thursday) is a daily average of all of our Truth-O-Meter rulings.

You've heard of the Dow Jones Industrial Average. Now we have the PolitiFact Truth Index.
Just as the Dow measures the ups and downs of the stock market, our Truth Index tracks the ups and downs of political discourse with a statistical average of PolitiFact's state and national Truth-O-Meter rulings.
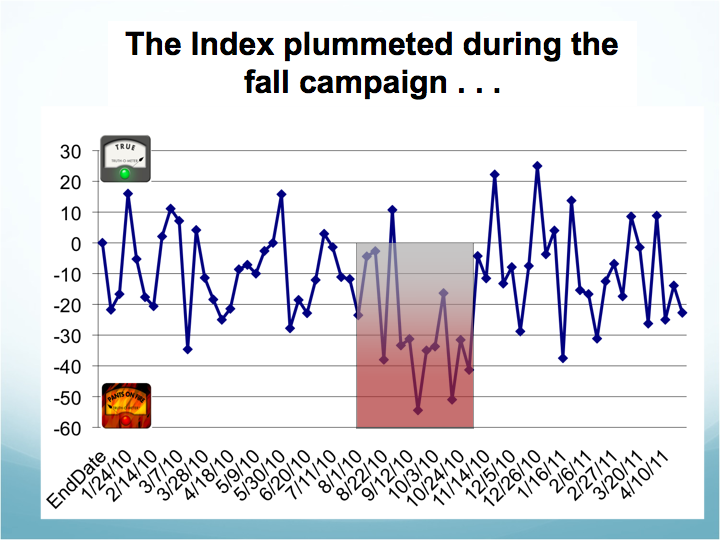
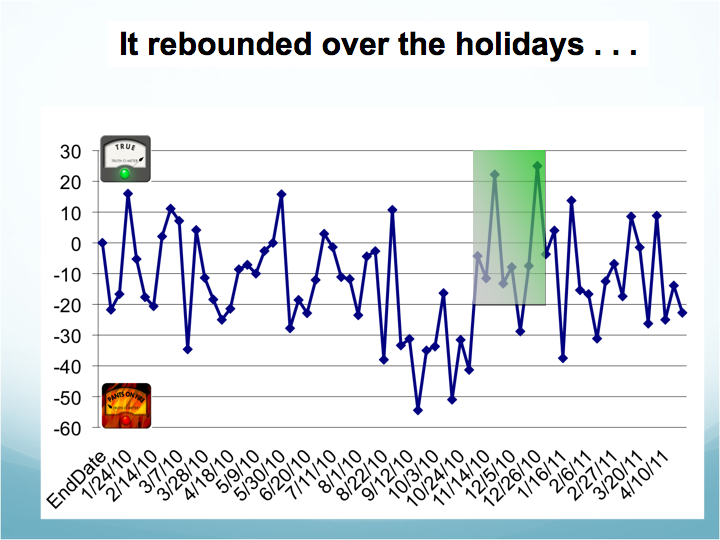
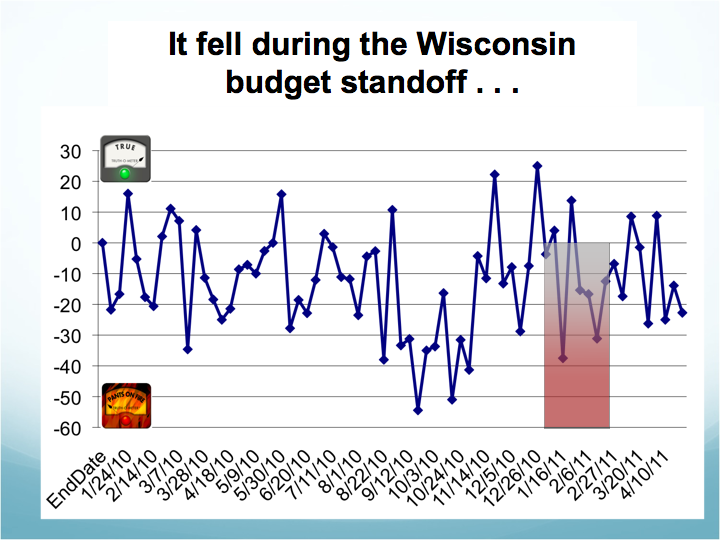
When we went back and calculated the Index for the past two years, we saw distinct patterns. It plummeted during the 2010 midterm elections because of the avalanche of misleading ads, but after the election, it rebounded. It fell again in February when the Wisconsin budget standoff prompted misleading claims from state and national political figures.
div#thumbnailGallery { width:301px; float:right; margin:5px 0 5px 10px; } #thumbnailGallery img { height:auto; width:auto; border:1px solid #000; }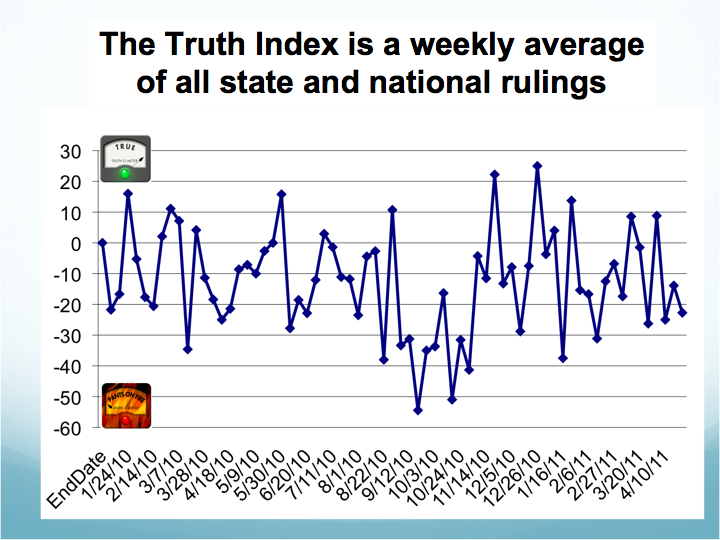

Our rulings have always reflected the trends of intense campaigns and political controversies; the Truth Index now provides a more precise way to follow those trends.
The best place to see the Truth Index is on our new PolitiFact app for iPhone, where it is updated daily. We'll also post occasional stories about the Index on our website.
An average of all Truth-O-Meter rulings
To calculate the Index, we use the Truth-O-Meter ratings from our national and state sites for the prior seven days. We chose seven days to get a larger sample and avoid the dramatic swings that would occur if it were based on one day.
We assign values to each ruling: 20 for True, 10 for Mostly True, 0 for Half True, -10 for Barely True, -20 for False and -30 for Pants on Fire. We add them up and divide the sum by the ideal score -- what the sum would have been if all statements were True. So you can think of the calculation like this:
Actual Truths ÷ Ideal Truths
For the sake of comparison, we then multiply the total by 100 so the index is reflected as a whole number.*
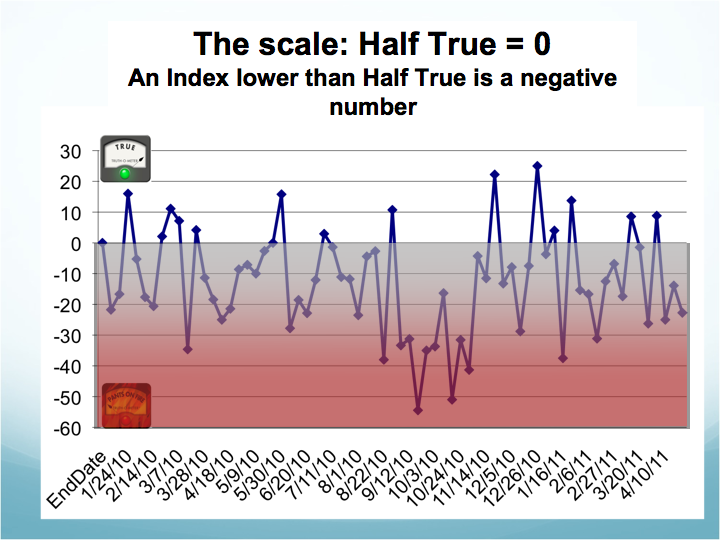
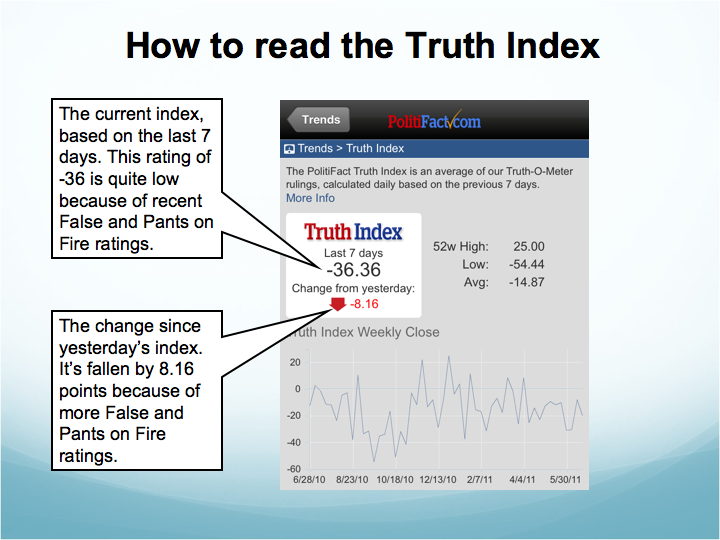
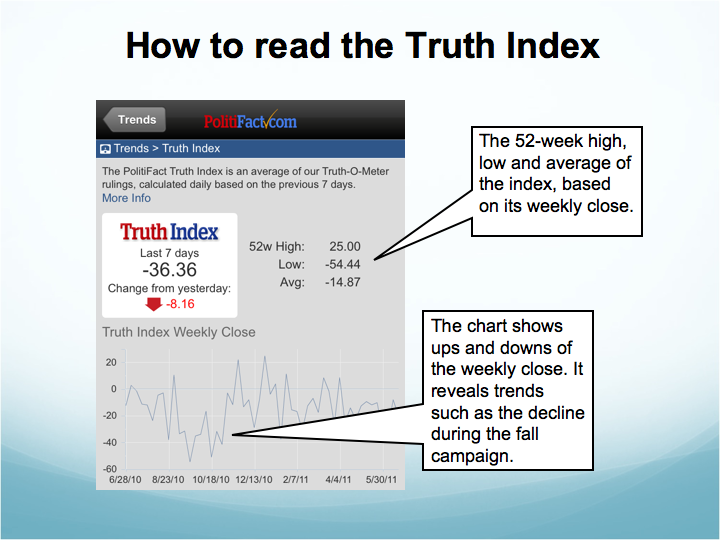
How to read the Truth Index
Because Half True is 0, it creates a helpful dividing line. If the Truth Index is a positive number, it indicates the average is higher than Half True. Likewise, if the Index is a negative number, it means lower than Half True.
We calculate the Index each day using the previous seven days of Truth-O-Meter rulings.
For the past 52 weeks, the Index has been as high as 25 (right before Christmas) and as low as -54 (in the heat of the fall campaign).
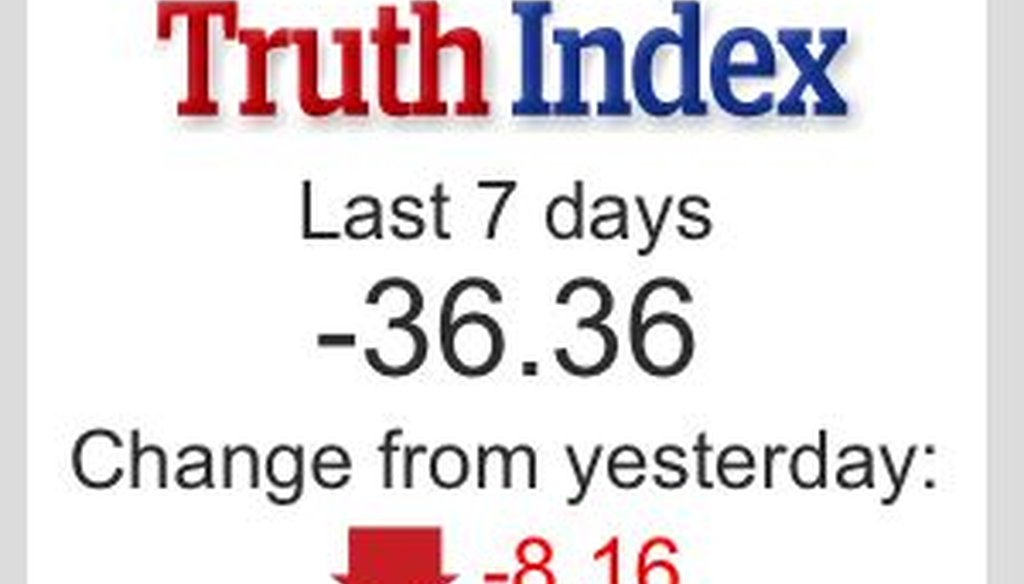
On the Truth Index screen on our PolitiFact app for iPhones and other devices, we display the latest Index and how much it has changed from the previous day. For example, last Thursday's rating was -36.36, which was down 8.16 from the previous day because of more False and Pants on Fire ratings (including a Pants on Fire for President Barack Obama).
The Truth Index screen also shows the 52-week high, low and average.
We'll be refining the Index and how we present it and would love to hear your thoughts and suggestions. Send them to [email protected].
------------------------------------------
* Here's the full formula:
(# True x 20) + (# Mostly X 10) + (# Half X 0) + (# Barely X -10) +
(# False X -20) + (# Pants on Fire X -30)
____________________________________________________________ X 100
(Total # Statements) X 20
Our Sources
See report.