Get PolitiFact in your inbox.
See how the economy has changed since Obama was elected in 2008.

In the hotly contested presidential campaign between President Barack Obama and Mitt Romney there is one undisputed point: the central issue is the state of the American economy.
End of agreement.
Were the country’s economic troubles deeper than expected when Obama took office in January 2009? Were his ideas and actions effective in righting the nation’s economic ship? Are things getting better? If so, are they getting better fast enough?
From both parties, the political rhetoric will be contentious for the next five months and, by its very nature, oversimplified. But below the fury there are objective metrics as to how the economy has performed on Obama’s watch and where it stands today.
PolitiFact.com, the independent fact-checking operation of the Tampa Bay Times, has produced a scorecard — key economic measures to track where the economy stood a year before Obama took office, where it was when he assumed power and how it has trended through May 2012.
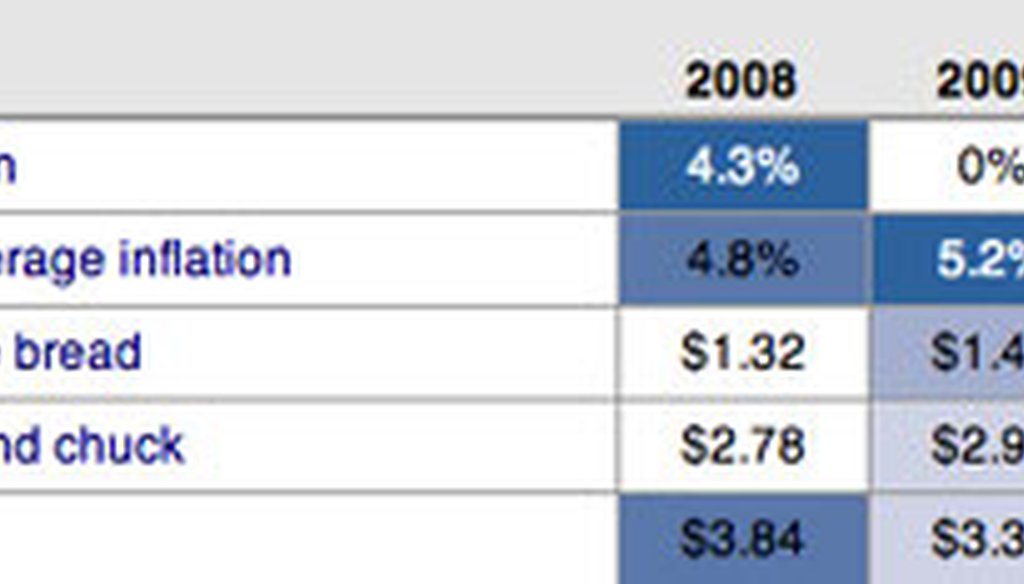
We’ve gathered statistics for everything from corporate profits to the price of ground chuck. To help you see which ones are up or down, we’ve shaded most of the statistics from white (the most positive number) to dark (the least positive). We offer figures for 2008, 2009, 2010, 2011 and 2012 — either an annual figure for the whole year or the monthly figure for January of that year. We also added a column for the most recent figures available.
Some analysis suggests the mixed record that most Americans feel:
• Gasoline prices, the rate of poverty, food stamp use and the federal debt are worse today than when the president took office.
• The unemployment rate, personal income and the stock market turned worse but are improving.
• Corporate profits, mortgage rates and the level of consumer debt are better today.
But the point of the scorecard is for you, the voters and consumers of political speech, to have factual measures by which to judge what you hear. The perspective you bring to it is all yours.
About these charts
To help you see how the numbers trend, we’ve shaded the statistics from white (the most positive number) to dark (the least positive). We haven’t shaded the numbers for government jobs because of differing opinions over whether more government employment is helpful to the economy.
.pfact_table {margin:0 0 9px 0;} .pfact_table table { width:620px; border-collapse:seseparate; border-spacing:0; border-bottom:2px solid #999; margin-top:20px;} .pfact_table a {text-decoration:none;} .pfact_table table th { font-size:12px; padding:1px; border-bottom:2px solid #999; font-weight:bold; vertical-align:bottom;} .pfact_table tbody {background-color:#fff;} .pfact_table table tr { } .pfact_table .topicname { font-size:12px; padding-left:4px; text-align:left; white-space:normal; max-width:200px;} .pfact_table h4 {text-align:left;} .pfact_table table td { font-size:12px; text-align:center; border-left:1px solid #999; padding:4px; vertical-align:bottom; border-bottom:1px solid #999; } .pfact_table table td.last { border-right:1px solid #999; } .pfact_table table td.one {background-color:#FFFFFF;} .pfact_table table td.two {background-color:#CED2E3;} .pfact_table table td.three {background-color:#A4AFCD;} .pfact_table table td.four {background-color:#8091BA;} .pfact_table table td.five {background-color:#5C79A9;} .pfact_table table td.six {background-color:#31649B; color:#fff;} .pfact_table table td.gray {background-color#aaa;}Jobs
2008 2009 2010 2011 January2012 April/May
2012 Unemployment rate 5% 7.8% 9.7% 9.1% 8.3% 8.2% Broader unemployment rate "U-6" 9.2% 14.2% 16.7% 16.1% 15.1% 14.8% White unemployment rate 4.4% 7.1% 8.7% 8.1% 7.4% 7.4% Black unemployment rate 9.1% 12.7% 16.5% 15.7% 13.6% 13.6% Hispanic unemployment rate 6.5% 10% 12.6% 12% 10.5% 11% Total private-sector jobs 115.6 M 111 M 106.8 M 108.2 M 110.5 M 111 M Total government jobs 22.4 M 22.6 M 22.5 M 22.2 M 22 M 22 M Median weeks unemployed 9 10.7 20.1 21.7 21.1 20.1
Income
2008 2009 2010 2011 January2012 April/May
2012 Yearly GDP $13.2 T $12.7 T $13.1 T $13.3 T -- $13.5 T Disposable personal income per capita $33,229 $32,166 $32,481 $32,667 -- $32,677 Personal bankruptcies 1,074,225 1,412,838 1,536,799 1,362,847 -- -- Poverty rate 12.5% 13.2% 14.3% 15.1% -- -- People receiving food stamps -- 32 M 39 M 44 M 46 M 46 M
Homes
2008 2009 2010 2011 January2012 April/May
2012 Median home sale price $232,400 $208,600 $218,200 $240,100 $221,700 $235,700 New homes sold in that month 44,000 24,000 24,000 21,000 23,000 33,000 Existing home sales, annualized 4.2 M 3.8 M 4.2 M 4.5 M 4.6 M 4.6 M Foreclosure starts 0.88% 1.08% 1.2% 1.27% 0.99% 0.96%
Business
2008 2009 2010 2011 January2012 April/May
2012 Corporate profits $1.2 T $1.4 T $1.8 T $1.9 T -- -- Bank failures 25 140 157 92 61 -- Corporate bankruptcies 43,546 60,837 56,282 47,806 -- -- Industrial production 100.4 87.4 87.4 92.5 96.5 97.4 Consumer confidence 87.3 37.4 56.5 64.8 61.5 64.9 Dow Jones Industrial Average 13,044 9,035 10,584 11,671 12,397 12,393 Labor productivity 103 103 109 110 111 --
Prices
2008 2009 2010 2011 January2012 April/May
2012 Overall inflation 4.3% 0% 2.6% 1.6% 2.9% 2.3% Food and beverage inflation 4.8% 5.2% -0.4% 1.8% 4.4% 3.1% Loaf of white bread $1.32 $1.40 $1.36 $1.40 $1.42 -- Pound of ground chuck $2.78 $2.99 $2.84 $3.07 $3.32 -- Gallon of milk $3.84 $3.34 $3.21 $3.39 $3.53 -- Pound of apples $1.28 $1.11 $1.07 $1.13 $1.18 -- Pound of sugar $0.51 $0.57 $0.63 $0.66 $0.71 -- Gasoline prices $3.16 $1.74 $2.72 $3.12 $3.36 $3.73 Residential natural gas per unit $12.24 $12.49 $10.56 $9.79 $9.55 $9.40
Debt and savings
2008 2009 2010 2011 January2012 April/May
2012 Personal savings rate 5.4% 5.1% 5.3% 4.7% -- 3.9% Outstanding credit card debt $948.5 B $955.5 B $856.2 B $794.7 B $800.8 B $803.6 B Household debt rate 18.4% 18.5% 17.4% 16.2% 15.9% -- Mortgage rates 5.76% 5.06% 5.03% 4.76% 3.92% 3.91%
Federal government
2008 2009 2010 2011 January2012 April/May
2012 Federal discretionary spending as percent of GDP 7.9% 8.9% 9.4% 9% -- 8.5% Federal mandatory spending as percent of GDP 11.1% 15% 13.3% 13.5% -- 14.4% Annual federal deficit $458 B $1.41 T $1.29 T $1.3 T -- $1.33 T Cumulative public debt $5.14 T $6.37 T $7.81 T $9.39 T $10.45 T $10.95 T
Footnotes
M indicates million and T indicates trillion.
Unemployment rate Unemployment rate for the civilian labor force, seasonally adjusted. Bureau of Labor Statistics. Monthly rate shown.
Broader unemployment rate "U-6" A broader unemployment measure than the basic unemployment rate. Includes total unemployed, plus all persons marginally attached to the labor force, plus total employed part time for economic reasons, as a percent of the civilian labor force plus all persons marginally attached to the labor force, seasonally adjusted. Bureau of Labor Statistics. Monthly rate shown.
White unemployment Unemployment rate for the civilian labor force, seasonally adjusted, for whites. Bureau of Labor Statistics. Monthly rate shown.
Black unemployment Unemployment rate for the civilian labor force, seasonally adjusted, for blacks or African Americans. Bureau of Labor Statistics. Monthly rate shown.
Hispanic unemployment Unemployment rate for the civilian labor force, seasonally adjusted, for Hispanics or latinos. Bureau of Labor Statistics. Monthly rate shown.
Total private-sector jobs Total private-sector jobs, seasonally adjusted. Bureau of Labor Statistics. Monthly rate shown.
Total government jobs Total government jobs (federal, state, local), seasonally adjusted. Bureau of Labor Statistics. Monthly rate shown.
Median weeks unemployed Median weeks unemployed, 16 and older, seasonally adjusted. Bureau of Labor Statistics. Monthly rate shown.
Yearly gross domestic product Real gross gomestic product, seasonally adjusted and inflation adjusted (table 1.5.6). GDP means the value of all finished goods and services produced within a country's borders during a year. Bureau of Economic Analysis. 2008-2011 are annual amounts, 2012 is 1st quarter at an annual rate.
Disposable personal income per capita Disposable personal income is defined as personal income (including employment compensation, proprietor and rental income, interest and dividends, and government transfer payments) minus taxes and payments for social insurance programs. Measure is inflation-adjusted (table 2.1). Bureau of Economic Analysis. 2008-2011 are annual amounts, 2012 is 1st quarter at an annual rate.
Personal bankruptcies Non-business bankruptcy filings. American Bankruptcy Institute. Annual figures shown.
Poverty rate Percent of all people below poverty level. Poverty levels vary by year, and by such factors as size of family, number of adults and children in a household and the age of adults in the household. For a family of two adults and one child, for instance, the Census Bureau's poverty threshold is $18,106. Census Bureau. Annual rate shown.
People receiving food stamps Persons participating in Supplemental Nutrition Assistance Program. Agriculture Department. Monthly figures shown for January of each year, except for final column, which is February.
Median home sale price Median sales prices of new homes sold in the United States. Census Bureau. Monthly figures shown for January of each year, except for final column, which is April.
New homes sold in that month New homes sold in the United States, not seasonally adjusted. Census Bureau. Monthly figures shown for January of each year, except for final column, which is April.
Existing home sales, annualized Existing home sales. Courtesy National Association of Realtors. Monthly figures at an annualized rate.
Foreclosure starts Mortgage foreclosure starts as a percentage of loans outstanding. Courtesy Mortgage Bankers Association. Figures are for fourth quarter of prior year, except final column, which is first quarter of 2012.
Corporate profits Corporate profits with inventory valuation and capital consumption adjustments. Bureau of Economic Analysis. Annual amounts.
Bank failures Federal Deposit Insurance Corp. Annual amounts, except for 2012, which is a projection based on 23 failures between Jan. 1, 2012, and May 18, 2012.
Industrial production Industrial Production Index, with 2007 level equal to 100, seasonally adjusted. Economagic.com. Monthly figures shown for January of each year, except for final column, which is April.
Consumer confidence Consumer confidence index, based on a random-sampling, national survey. Courtesy of the Conference Board. Figures for 2008 to 2012 are for January; final column is for May 2012.
Dow Jones Industrial Average Dow Jones Industrial Average close for the first day of the year after Jan. 1. Yahoo! Finance. Final column is close for May 31, 2012.
Labor productivity Business output per hour; index with 2005 equal to 100. Bureau of Labor Statistics . Index is for first quarter of each year shown.
Overall inflation Consumer Price Index for All Urban Consumers (CPI-U) for prior 12 months, not seasonally adjusted. The CPI-U is a measure of the average change over time in the prices paid by urban consumers for a representative variety of consumer goods and services. Bureau of Labor Statistics. Based on the January figures for each year, except for the final column, which is based on the April 2012 figures.
Food and beverage inflation Consumer Price Index for All Urban Consumers (CPI-U) for food and beverages for prior 12 months, not seasonally adjusted. This measures inflation in the portion of the goods used to calculate CPI-U that are either foods or beverages. Bureau of Labor Statistics . Based on the January figures for each year, except for the final column, which is based on the April 2012 figures.
White bread, ground chuck, milk, apples, sugar Data courtesy of the Food Institute, based on government data. Figures are for first quarter of the given year.
Gasoline prices U.S. retail gasoline prices for all grades and all formulations in dollars per gallon. Energy Information Administration. Data are for the first week of January in each year, except for final column, which is for the third week of May.
Residential natural gas per unit U.S. price of natural gas delivered to residential consumers, in dollars per thousand cubic feet. Energy Information Administration. Data are for the month of January in each year, except for the final column, which is for February 2012.
Personal saving rate Personal saving as a percentage of disposable personal income. Bureau of Economic Analysis. 2008-2011 are annual amounts, final column is 1st quarter 2012.
Outstanding credit card debt Revolving consumer credit outstanding, seasonally adjusted. Federal Reserve Board. January data for all years except for final column, which is March 2012.
Household debt rate Financial obligations as a percentage of disposable personal income; seasonally adjusted. Financial obligations include mortgages, consumer debt, automobile lease payments, rental payments on tenant-occupied property, homeowners' insurance, and property tax payments. Federal Reserve Board. Figures are for first quarter for 2008-2011; figure for 2012 is fourth quarter of 2011.
Mortgage rates Contract rate on 30-year, fixed-rate, conventional home mortgage commitments. Federal Reserve Board. Figures are for January in 2008-2012; final column is for April 2012.
Federal discretionary spending as a percent of GDP Office of Management and Budget. By fiscal year. 2012 figure is OMB estimate.
Federal mandatory spending as a percent of GDP Office of Management and Budget. By fiscal year. 2012 figure is OMB estimate.
Annual federal deficit Office of Management and Budget. By fiscal year. 2012 figure is OMB estimate.
Cumulative federal debt Publicly held debt, cumulative. Bureau of the Public Debt. Amount of debt outstanding on Jan. 1.
Our Sources
See chart.