Stand up for the facts!
Our only agenda is to publish the truth so you can be an informed participant in democracy.
We need your help.
I would like to contribute
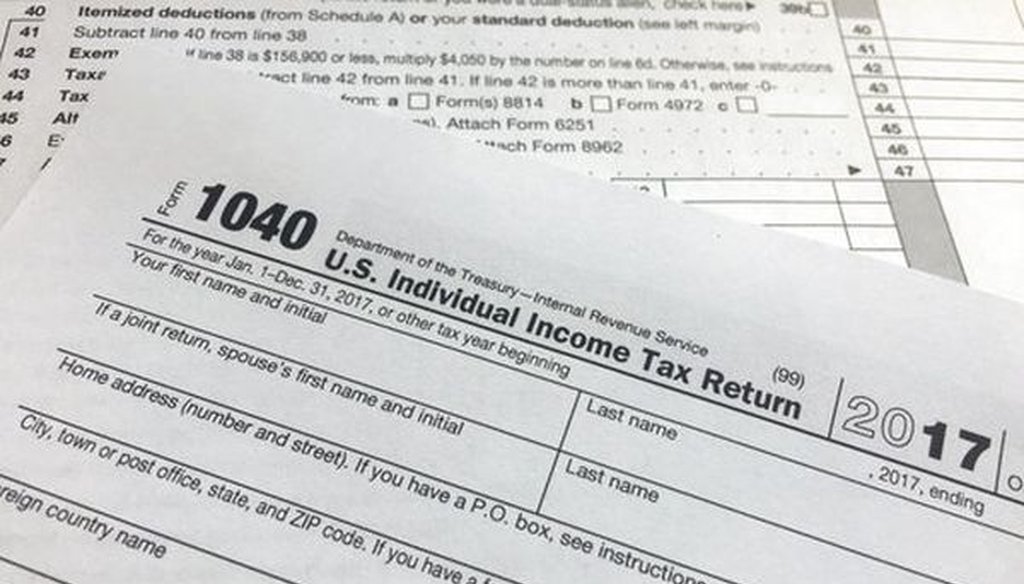
The large tax bill passed by the Republican Congress and signed by President Donald Trump is not getting mentioned much on the midterm campaign trail, perhaps because the public seems to be lukewarm on whether it was a good idea.
But taxes, like death, are among the few certainties in life. So we decided to take a graphical look at both the new tax law and the broader landscape of taxation in the United States.
As the chart below indicates, Americans are typically taxed three times — by the federal government, by their state government, and by their local government.
Overall, federal taxation accounts for a majority of tax revenues in the United States — about 54 percent. These taxes are marked in shades of blue in our pie chart. Individual income taxes account for the biggest share of federal taxes, followed by social insurance and retirement taxes. Corporate taxes rate a distant third.
State taxation accounts for the second-largest source of tax revenue, at just under 26 percent of all taxation in the United States. These taxes are marked in the brown shades on our pie chart. The biggest source of state taxation is sales taxes, followed by income taxes.
Finally, the smallest share is local taxes, at about 20 percent. Local taxes are marked in shades of green. The biggest type of local taxation is the property tax.
Now we’ll shift gears to focus exclusively on federal taxation.
In the postwar era, the amount of overall federal tax revenues compared with the size of the economy has stayed strikingly constant. The chart below shows federal tax revenue as a share of gross domestic product for the nation as a whole.
The chart shows that while the level of overall federal taxation has risen and fallen depending on the overall health of the economy, it has moved only within a narrow band for decades -- between 15 percent and 20 percent of GDP since the 1940s.
Since the end of World War II, the percentage of federal tax revenues derived from the individual income tax has remained steady, at between 40 percent and 50 percent of all federal tax revenue.
But the breakdown of other taxes has changed dramatically, as the following chart shows.
At the end of World War II, corporate taxes accounted for about 30 percent of all federal taxes collected. But that has shrunk dramatically, today accounting for only 9 percent of federal tax revenues.
By contrast, social insurance and retirement taxes -- those that support programs like Social Security and Medicare -- have surged. After World War II, these taxes accounted for about 8 percent of federal taxation. Today, they are about 35 percent.
The United States has a progressive tax system, meaning that higher-income individuals and families don’t just pay more than those with lower incomes do -- they pay a higher tax rate the higher their income goes.
While wealthy taxpayers have ways to legally cut their tax bill, they still end up paying a disproportionate share of federal taxes, as the chart below shows.
The top quintile -- that is, the top 20 percent -- of the income spectrum is shown in shades of blue. Collectively, this group about 70 percent of federal taxation -- far above their 20 percent of the population. And that share has risen over time. In 1979, this group footed about 55 percent of the bill.
The chart shows that, over time, the other income groups have seen their share of the burden shrink.
Today, the second-highest quintile accounts for about 17 percent of the tax burden, a little less than their share of the population. The middle quintile pays about 9 percent, the second-lowest quintile pays a bit less than 4 percent, and the lowest quintile pays a minimal three-tenths of one percent.
The law — passed without any Democratic support in December 2017 — cut the corporate income tax rate, changed international tax rules, and reduced taxation on so-called "pass-through" business income taxed on personal filings. The law also raised the standard deduction while curbing the alternative minimum tax and raising the threshold for applying the estate tax exemption
Overall, the good news for taxpayers is that every income group would pay less in taxes in 2019. (This is the case for these income groups as a whole — individual taxpayers may not necessarily gain, depending on a taxpayer’s specific circumstances.)
That said, the benefits of the tax bill would flow disproportionately to wealthier taxpayers, as the top chart on the following slide shows.
About half of the households filing returns had incomes below $50,000, according to the Joint Committee on Taxation, but they collectively get just 6.6 percent of the tax gains in the bill.
By contrast, only about 1 percent of households filing returns had incomes above $500,000, but they stand to gain 23 percent of the benefits from the bill. (Again, since taxpayers with higher incomes pay a higher tax rate, it’s not surprising that wealthier taxpayers would receive a greater share of the benefits in a tax bill.)
Meanwhile, the benefits of the 2017 law for lower- and moderate-income taxpayers are front-loaded. They largely disappear by 2027, as the bottom chart on the slide above indicates.
By 2027, almost 76 percent of households in the top 1 percent would see a tax cut, and almost 92 percent of households in the top 0.1 percent would see a tax cut. (The top 1 percent in 2027 are projected to earn $912,000, and the top 0.1 percent is projected to be making more than $5 million a year.)
By contrast, fewer than one-third of taxpayers in the bottom 80 percent of the income spectrum would see a tax cut in 2027.
Why the big changes by 2027? The primary reason is that some of the individual tax cuts phase out in 2025. In addition, some of the inflation adjustments used under the bill are less generous than the current ones.
Our Sources
Joint Committee on Taxation, "Distributional Effects Of The Conference Agreement For H.R.1, The Tax Cuts And Jobs Act," Dec. 18, 2017
Urban Institute-Brookings Institution Tax Policy Center, "Distributional Analysis of the Conference Agreement for the Tax Cuts and Jobs Act," Dec. 18, 2017
Urban Institute-Brookings Institution Tax Policy Center, "Shares of Federal Tax Liabilities for All Households," accessed Oct. 12, 2018
Urban Institute-Brookings Institution Tax Policy Center, "Percentage of Revenue by Source," accessed Oct. 12, 2018
Urban Institute-Brookings Institution Tax Policy Center, "Source of Revenue as Share of GDP," accessed Oct. 12, 2018
Urban Institute-Brookings Institution Tax Policy Center, "Revenue by Government Level," accessed Oct. 12, 2018
Brookings Institution, "Effects of the Tax Cuts and Jobs Act: A preliminary analysis," June 14, 2018
Pollingreport.com, tax polling archive, accessed Oct. 12, 2018
Email interview with Joseph Rosenberg, senior research associate at the Urban Institute-Brookings Institution Tax Policy Center, Oct. 12, 2018
Email interview with John Buhl, spokesman for the Tax Foundation, Oct. 12, 2018


