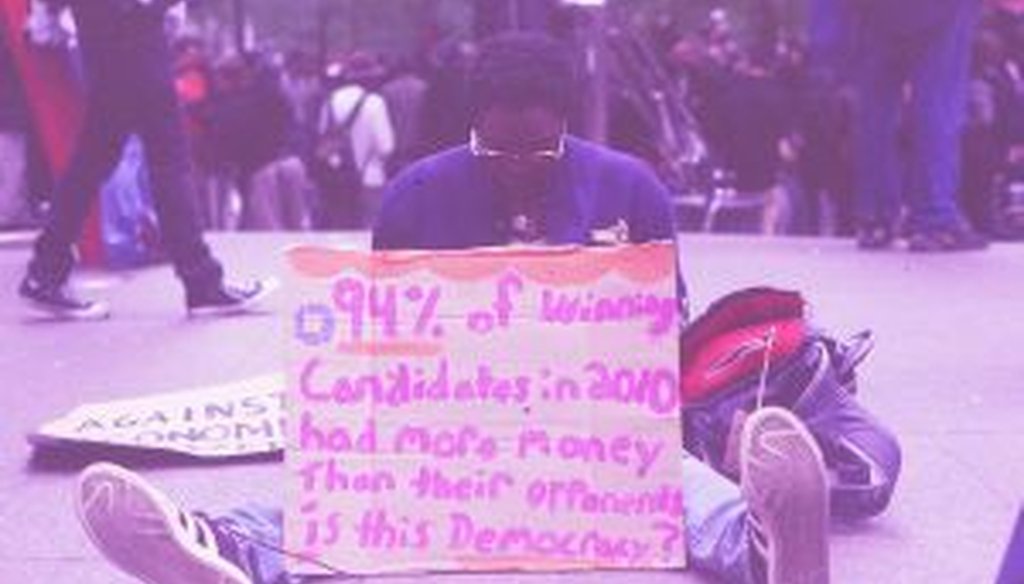
"94 percent of winning candidates in 2010 had more money than their opponents."


Our only agenda is to publish the truth so you can be an informed participant in democracy.
We need your help.
In a photograph posted at Flickr, an Occupy Wall Street protester at Zuccotti Park in New York City offers a statistic on money's influence in politics.

A reader recently sent us a link to a photograph taken at the Occupy Wall Street protest in New York City’s Zuccotti Park on Oct. 5, 2011. It showed a protester holding a sign that said, "94% of winning candidates in 2010 had more money than their opponents. Is this Democracy?"
This statistic has been cited in a number of other forums recently. For instance, MSNBC host Dylan Ratigan -- who is backing a petition for a constitutional amendment to "Get Money Out" of politics -- used it on Martin Bashir’s MSNBC show on Sept. 27, 2011.]
Ratigan said "there is a single statistic that I think is the only statistic that you need to understand about money and politics in America. … If you look at campaign for federal office, Congress, president, whatever, … if I know who raised more money, without even knowing anything else, 94 percent of the time I will pick the winner."
We took up the reader’s suggestion to fact-check the statistic.
We’ll first note that the creator of the sign is not specific about what offices are being referred to. We found two data sets that directly address the issue, both compiled by nonpartisan groups that track money in politics. One is the Center for Responsive Politics, which tracks spending patterns in races for U.S. House and Senate seats. The other is the National Institute on Money in State Politics, which tracks spending in state legislative contests.
In congressional races in 2010, the candidate who spent the most won 85 percent of the House races and 83 percent of the Senate races, according to the Center for Responsive Politics. That’s a large percentage, but it’s lower than what the sign indicated.
Indeed, the percentage for 2010 was lower than it had been in recent election cycles. The center found that in 2008, the biggest spenders won 93 percent of House races and 86 percent of Senate races. In 2006, the top spenders won 94 percent of House races and 73 percent of Senate races. And in 2004, 98 percent of House seats went to candidates who spent the most, as did 88 percent of Senate seats.
So the protester’s sign would have been essentially correct had it not specifically cited 2010 -- though even then, it would only be true for the House and not for the Senate, which has consistently seen lower percentages of the bigger spenders win.
Meanwhile, the success rate of big spenders has been lower at the state level.
The most recent figures, from the 2008 election cycle, show that 80 percent of state legislative candidates with the monetary advantage won their contests. In 2006, it was 83 percent; in 2004, it was 84 percent; and in 2002, it was 82 percent. (The group’s figures for 2010 are due to be released in the next month or so.)
So the percentages for state legislative races have also been consistently lower than what the sign indicated.
Our ruling
The protester has a point: Even in the relatively atypical year of 2010, a large majority of contests for congressional and state legislative races were won by candidates who spent the most money, and the 94 percent mark was reached in federal races in 2006 and nearly again in 2008.
Still, the sign’s figures were off. In 2010 -- which is not only the most recent election year but also the year specifically cited in the sign -- the percentage of big-money winners in U.S. House races was actually 85 percent, or nine points lower. And the percentages of U.S. Senate seats and state legislative seats won by the deeper-pocketed candidate have been consistently lower in recent election cycles. On balance, we rate the statement Mostly True.
Photograph of Occupy Wall Street protester holding sign, Oct. 5, 2011
Center for Responsive Politics, "Bad News for Incumbents, Self-Financing Candidates in Most Expensive Midterm Election in U.S. History," Nov. 4, 2010
National Institute on Money in State Politics, "The Role of Money & Incumbency in 2007-2008 State Elections, 2007–2008 Compared to Previous Cycles," accessed Oct. 17, 2011
Raw Replay, "Dylan Ratigan starts campaign to get money out of politics," Sept. 27, 2011
E-mail interview with Evan MacKinder, spokesman for the Center for Responsive Politics, Oct. 17, 2011
Interview with Denise Roth Barber, managing director of the National Institute on Money in State Politics, Oct. 17, 2011


In a world of wild talk and fake news, help us stand up for the facts.