Stand up for the facts!
Our only agenda is to publish the truth so you can be an informed participant in democracy.
We need your help.
I would like to contribute
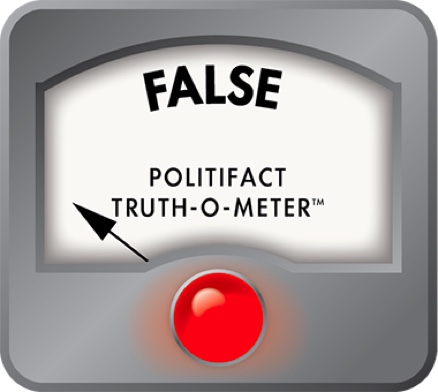
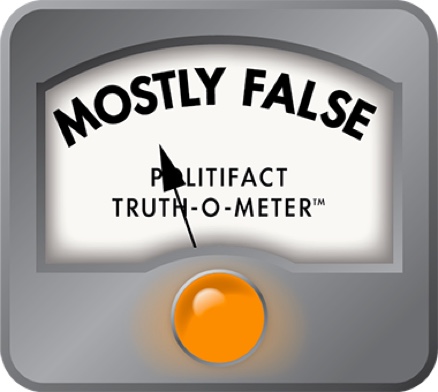
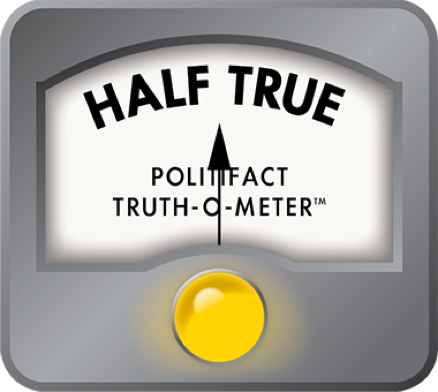
SUMMARY: Sen. Hillary Clinton cites many numbers and lays plenty of blame for the income disparity between rich and poor, but you can't pin a broad economic trend on a single set of policies.
Sounds bad, doesn't it?
At campaign speeches across Iowa, Sen. Hillary Clinton has been counting the ways President Bush boosted the economic fortunes of the rich at the expense of the poor and middle class, and she offers this startling nugget:
In 2005, the wealthiest 1 percent of Americans earned 22 percent of the nation's income.
The notion that so few folks earn so much of the wealth seems downright… un-American. As they campaign for the presidency, Clinton and her fellow Democrats cite the growing gap between rich and poor as a good reason why putting another Republican in the White House would be disastrous for working people.
"In 2005, the last year I could find the numbers for, all income gains went to the top 10 percent of households .... That is not the America that I grew up in," Clinton said during a Nov. 19, 2007 speech in Knoxville, Iowa.
"The wealthiest 1 percent of Americans held 22 percent of America's income. That's an astonishing figure, and it is the highest level of income inequality since the beginning of the Great Depression in 1929."
And it's true. Under Bush, the disparity between the very rich and the rest of us has risen to its highest level since the Great Depression, government and independent studies show.
But blame Bush? Balderdash. Experts say it's unfair to pin the growing gap on the president, even if his policies – particularly more tax breaks for the rich – have contributed to economic inequality overall. In fact, the income gap has been growing since 1968 and really began to soar in the 1980s.
And the last time the gap between rich and poor was this wide? Before the burst of the Internet stock market bubble back in 2000, when Sen. Clinton was living in the White House with her husband, President Bill Clinton.
"It's a longer term trend, and more than that, there's a lot of debate about what's causing it," said Aviva Aron-Dine, a policy analyst at the nonpartisan Center on Budget Policy and Priorities, which advocates for the poor.
The income gap actually grew more during the Democratic Clinton administration than it has during the Bush administration. According to U.S. Census data, the share of income for the wealthiest 5 percent rose from 18.6 percent in 1992 to 22.1 percent in 2000. That's a jump of almost 19 percent.
During the Bush years, the share of the wealthiest 5 percent has grown from 22.1 percent of total income in 2000 to 22.3 percent last year, a rise of less than 1 percent.
"Bush actively contributed to the rise in inequality through his tax and regulatory and enforcement polices," said Gary Burtless, a senior fellow in economic studies at the liberal-leaning Brookings Institution. "He passively accepted many of the economic trends that pushed up inequality. But he is not mainly to blame for increased inequality."
Sen. Clinton gets her figures from a study in the respected Quarterly Journal of Economics that was published first in 2005, then updated this year. The researchers, economists Emmanuel Saez of the University of California at Berkely and Thomas Piketty of the L'cole des Hautes Etudes en Sciences Sociales in Paris, used Internal Revenue Service tax returns from 1913 to 2005 to produce a detailed analysis of income through the years.
They found that in 2005, more than $1 of every $5 earned in the United States went to the wealthiest 1 percent of people, those who made more than $350,500 per year. That's the widest disparity since 1929.
The IRS income data includes wages, salaries, pensions, business profits, capital income and the like, but excludes most so-called government transfers, such as Social Security and unemployment benefits. Economists on the left and the right point out that including those payments may have somewhat softened the disparity, but not by much. Some scholars also note that companies are paying more than ever for employee health insurance and other benefits, and that type of compensation isn't reflected in tax returns.
But no one disputes the crux of the findings, that the very rich are outpacing everyone else. The U.S. Census Bureau offers similar findings.
Last year, the top 5 percent earned 22.3 percent of the income, while the poorest 20 percent earned just 3.4 percent of the income, according to Census data.
In fact, in 2006, just over half of all the income in the United States went to those in the top 20 percent of earners.
Policy wonks have been fretting about the trend for more than a decade, and Bush himself has expressed concern about it. But the reasons behind the trend are global and complex.
Economists cite a series of factors, including increased foreign competition and cheap overseas labor, particularly in the manufacturing sector; the decline of powerful labor unions; and out-sourcing well-paid government or corporate duties to inexpensive subcontractors.
They also blame astronomical salaries on Wall Street and changing social norms regarding pay for corporate executives, which has made it acceptable for CEOs to earn hundreds of times more than their employees – even when their companies fail to perform.
But while the gap grew under Clinton as well as Bush, the administrations have responded to it in different ways.
In 1993, Clinton raised taxes on the very wealthy; in 2001, Bush cut them. The Clinton administration pushed a state-federal program to provide health insurance for the children of the working poor; this year, Bush twice vetoed a bipartisan bill to expand it, on grounds it would help families who earn too much to need it.
There was another difference about the Clinton administration as well: The rich gained big, but most everyone else did, too, federal income data show. Median income, adjusted to 2006 dollars, increased from $43,135 in 1992 to $49,163 in 2000. A rising tide lifted all boats.
That's not been the case during the Bush era. The median family income has dropped by $1,000 since 2000, adjusted for 2006 dollars, Census data show. The prices of food, gas and health care have increased. Five-million more Americans are living in poverty. And polls show consumer confidence is low.
What's more, Piketty and Saez's analysis showed that from 2004 to 2005, virtually all of the net gains in income went to the top 10 percent of earners, while income for the remaining 90 percent of Americans stayed about the same when adjusted for inflation.
"In the current period... the top is seeing gains, while people in the middle of the spectrum really have been treading water," said Aron-Dine, of the Center on Budget Policy and Priorities. "You could be less concerned about inequality where you have (widespread) income growth, versus when some go up a lot, and others not all."
Our Sources
Interview with Emmanuel Saez, professor of economics, University of California at Berkeley, Dec. 11, 2007
Interview with Gary Burtless, senior fellow in economic studies, Brookings Institution, Dec. 11, 2007
Interview with Aviva Aron-Dine, policy analyst, Center on Budget Policy and Priorities, November 2007
Quarterly Journal of Economics, Income Inequality in the United States,February 2003
U.S. Census Bureau, Historical aggregate income, by fifths and top 5 percent
Center on Budget and Policy Priorities, Analysis of the Saez-Piketty data>a/>
The Heritage Foundation, Shared Prosperity: Debunking Pessimistic Claims about Wages, Profits and Wealth
Tax Policy Center, Bush Administration Tax Policy: Distributional Effects
U.S. Census Bureau, Poor and the near-poor, 1959 to 2006
U.S. Bureau of Labor Statistics, Nonfarm business productivity, 1997 to 2006
U.S. Bureau of Labor Statistics, Nonfarm business productivity, by year and with percentage increases, 1997-2006
U.S. Census Bureau, Median Income, 1984 to 2006, nationally and by state, adjusted to 2006 dollars
U.S. Census Burea, Income by education level, 1995 to 2000
Economic Policy Institute, State of Working America, wages and productivity


