Stand up for the facts!
Our only agenda is to publish the truth so you can be an informed participant in democracy.
We need your help.
I would like to contribute
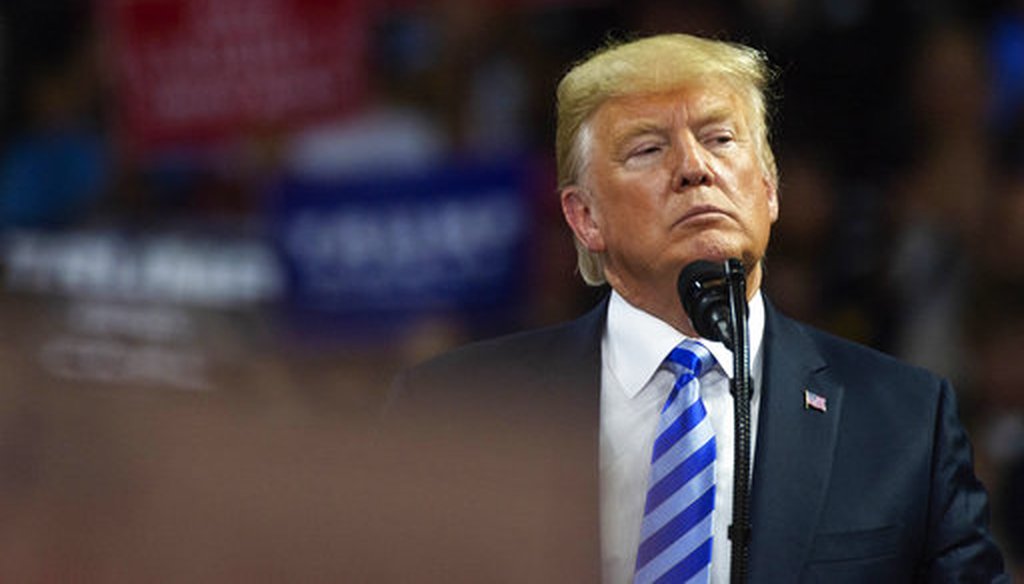
President Donald Trump takes the stage at a rally in support of the Senate candidacy of West Virginia's Attorney General Patrick Morrisey, on Aug. 21, 2018, in Charleston, W.Va. (Craig Hudson/Charleston Gazette-Mail via AP)
Democrats have deployed a staggering statistic to attack Republicans on health care. While the details might vary, the common thread is that 4 million Americans have lost their health insurance under President Donald Trump.
An essay on the liberal blog Politics USA recently carried the headline, "Trump Celebrates 4 Million Americans Losing Their Health Insurance."
On CNN’s State of the Union, Democratic pundit Jennifer Granholm predicted health care would drive voters to the polls in November.
"Under the Trump administration, 4 million people have lost their health care," Granholm said Aug. 19.
President Donald Trump and Congress have taken steps to chip away at the Affordable Care Act that helped millions gain coverage. But have 4 million people lost their health insurance as a result?
Sign up for PolitiFact texts
New numbers don’t back that up. (We decided not to rate Granholm's statement on the Truth-O-Meter because the new information was not published when she made her claim.)
When we previously looked at this question, we rated Half True a claim that Republican "sabotage" of Obama’s signature legislative achievement cost 3.2 million people coverage in 2017.
In light of new federal data, we’ve decided to untangle the numbers of uninsured Americans in the Trump era.
A number of estimates exist to gauge the percent of Americans with and without health insurance. Two estimates that capture a lot of attention are a federal survey and a tracking poll from the center-left Commonwealth Fund.
According to experts, the most authoritative index of health coverage rates in America comes from the National Health Interview Survey, a program under the Centers for Disease Control and Prevention.
"The NHIS is the gold standard," said Katherine Hempstead, a senior advisor at the Robert Wood Johnson Foundation.
Here’s the upshot from the NHIS: the uninsurance rate has increased one-tenth of 1 percentage point during Trump’s presidency.
That translates to roughly 100,000 fewer adults with coverage from 2016 to 2018, which could be a statistical blip:
As the graph shows, the rate of uninsured adults remains relatively flat from 2015 through the first quarter of 2018.
Authors of the NHIS report noted that after an increase in the uninsurance rate of non-elderly adults, the rate has since "decreased and then stabilized."
Another frequently cited estimate comes from the center-left Commonwealth Fund, which tracks uninsurance rates through polling.
The survey’s findings have figured as something of a talking point on the left, perhaps because they show much bigger losses of coverage under Trump than NHIS data.
Charting Commonwealth’s data over the last six years produces something resembling the start of a U-shaped curve:
The data shows about one in five were uninsured in 2013. That rate drops in the final years of Barack Obama’s presidency as more people gained coverage. It then climbs up under Trump.
According to the Commonwealth Fund data, this translates to about 4 million people having lost coverage since 2016.
It’s worth noting the models used by Commonwealth and NHIS are not identical:
-
The NHIS sample size is much bigger than Commonwealth’s (NHIS polled 19,510 people of all age, versus Commonwealth’s survey of 2,403 adults, ages 19 to 64);
-
They defined adults differently (for NHIS it’s 18-64; Commonwealth tracks ages 19 to 64);
-
The NHIS poll ran from January through March; Commonwealth’s survey ran from February to March.
Owing to its larger sample size, experts encouraged us to put more weight on the NHIS data.
Even the Commonwealth Fund suggests its own findings should be considered alongside the federal figures.
"Forthcoming results from large federal surveys like the National Health Interview Survey will shed more light on the trends our survey has identified," the pollsters wrote in May.
(Another common estimate comes from Gallup, but they changed their methodology in 2018 and the results may not be directly comparable to previous findings.)
Bottom line: NHIS’ estimate of 100,000 losing insurance during Trump’s presidency is probably a much more reliable figure than Commonwealth’s 4 million estimate.
Hempstead, of the Robert Wood Johnson Foundation, said the NHIS figures suggest the downturn in Obamacare exchange enrollment has occurred at the same time that more people have gained insurance through their job.
"It looks like the decline in the Affordable Care Act marketplace was offset by gains in employer-sponsored insurance," she said.
Given the Trump administration’s opposition to Obamacare, it’s hard to predict where the trendline might go.
Our Sources
National Health Interview Survey, Aug. 29, 2018
CNN, "CNN Poll: Democratic advantage grows in race for Congress," Aug. 16, 2018
PolitiFact, "Did Republican sabotage cost 3.2 million their health coverage?" June 1, 2018
CNN’s State of the Union, Aug. 19, 2018
Commonwealth Fund, "First Look at Health Insurance Coverage in 2018 Finds ACA Gains Beginning to Reverse," May 1, 2018
Email interview with Joe Antos, a health care policy expert at the conservative American Enterprise Institute, Aug. 23, 2018
Email interview with Katherine Hempstead, a senior advisor at the Robert Wood Johnson Foundation, Aug. 29, 2018


