Stand up for the facts!
Our only agenda is to publish the truth so you can be an informed participant in democracy.
We need your help.
I would like to contribute
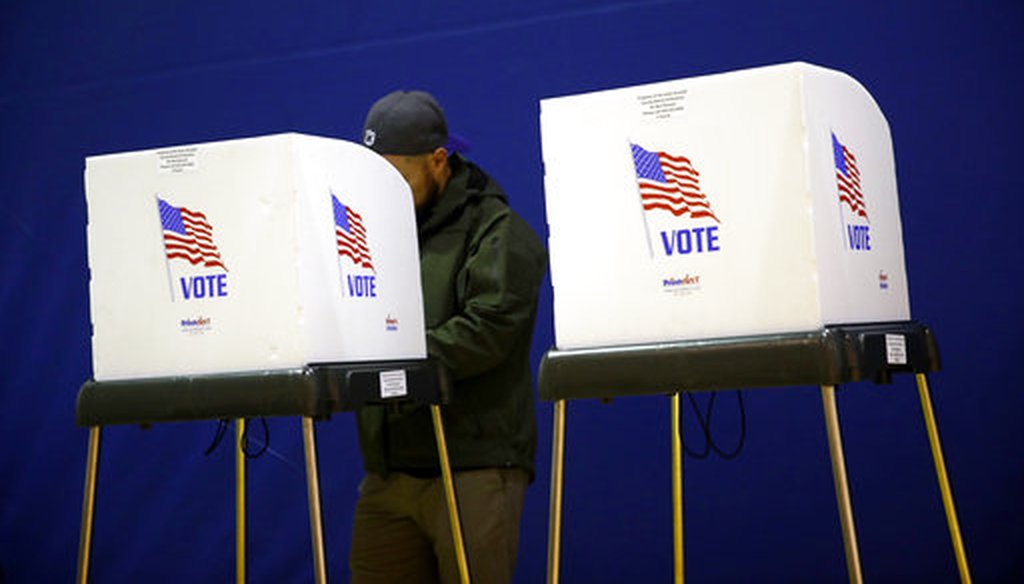
A voter fills out a ballot at a polling place in Pasadena, Md., on Nov. 6, 2018. (AP)
As the 2020 election pushes ahead, voters will be seeing poll results in their news feed — lots of them. But not all polls are created equal, and it can be hard to put the results into the proper context.
PolitiFact participated in a workshop hosted by the Poynter Institute (which owns PolitiFact) on understanding election polling. Here are some suggestions about what voters should pay attention to when reading polls.
- Margins of error
- State polls
- Weighting for education
- Likely voter screens
- Weighting for partisan identification
- Poll wording
- Cherry-picking polling results
- Undecided voters
- Cell phone and internet polling
Margins of error
It’s always important to know a poll’s margin of error, so you can understand the limits of what the poll is saying.
A poll’s margin of error reflects how much confidence the pollster has that the sample of respondents has not been accidentally skewed in a way that makes it unrepresentative of the population at large.
Generally speaking, the more people contacted for a poll, the smaller the margin of error. At a certain point, usually around 4,000 or 5,000 respondents, the margin of error reaches about 1 percentage point and stops shrinking.
The effort to get the margin of error that low can incur large additional expense, so it’s fairly common for polls to survey about 1,000 respondents, a number that produces a margin of error of roughly 3 percentage points — not the lowest rate possible, but a level that balances accuracy with affordability.
In a poll that has a margin of error of plus or minus 3 percentage points, a candidate who is ahead by a 51%-49% margin doesn’t actually lead the race based on that poll. It’s entirely possible that the "leading" candidate in this case has 48% support and the "trailing" candidate has 52%. So this race is most accurately described as too close to call.
Similarly, for most polls it would be incorrect to say that there’s majority support for a given policy if that policy secures 51% backing in the poll. For a typical-sized poll, the margin of error would be enough to shrink that 51% below the threshold for a "majority."
Large margins of error can be particularly troublesome in "sub-samples" of poll results, such as looking only at only Hispanic voters, or Republicans or people with college degrees. Since just a fraction of the population falls into these categories, the sample size for these groups will be smaller than the full universe of those who answered the poll. Smaller pools of respondents have larger margins of error.
This came into play in a fact-check of a claim by Democratic presidential candidate Andrew Yang about his levels of support from past Trump voters. Part of the problem with his claim was that the weekly poll he cited typically found only 30 to 40 expected Democratic primary voters who had voted for Trump in 2016, which is a small fraction of the 1,500 people the poll surveyed overall. A sub-sample with just 30 to 40 respondents has a margin of error of 15 percentage points, calling into question almost any conclusion you might make from that data.
State polls
State polls tend to be undertaken less frequently than national polls, and they are often conducted by smaller polling organizations. Cutbacks at newspapers and other local media outlets have made state polling even more challenging.
In 2016, national polls were significantly more accurate than state-level polls. National polls had Hillary Clinton up by about 3 percentage points, which was basically correct, as she won the popular vote by 2 percentage points.
On the other hand, state polls in 2016 were seriously off-base. And that proved to be a big problem, because it is the Electoral College, not the popular vote, that determines the presidential winner.
Trump won the presidency by narrowly carrying the battleground states of Michigan, Pennsylvania and Wisconsin, yet "polls showed Hillary Clinton leading, if narrowly, in Pennsylvania, Michigan and Wisconsin, which had voted Democratic for president six elections running," said a self-examination of 2016 polling by the American Association for Public Opinion Research. "Those leads fed predictions that the Democratic ‘blue wall’ would hold."
The polling association pointed to several issues that led to underestimated voter support for Trump, including late-deciding voters choosing Trump after the last surveys published their results.
Weighting for education
Perhaps the biggest single problem with 2016 state polls was a decision by many of them not to "weight" for educational attainment.
Weighting refers to adjusting poll responses so that the demographics of the sample approximate the demographics of the population being surveyed. Demographic groups that happened to be underrepresented in a given poll are given more weight in shaping the final results; groups that are overrepresented in the poll will have their impact reduced. This helps produce a sample that mirrors the whole population more closely. Weighting is commonly done for certain basic factors such as race and ethnicity.
What the past few years have demonstrated is that electoral outcomes are increasingly driven by a few key demographic factors, notably educational attainment. Those without college educations are increasingly backing Republicans and Trump, while college-educated voters are increasingly voting for Democrats.
Polls that did not weight for educational attainment in 2016 produced overly rosy numbers for Clinton.
"The industry has known for years that they have to adjust for education, because for whatever reason, people with more formal education are more likely to respond to polls than people with less," said Courtney Kennedy, the director of survey research at the Pew Research Center. "That was a fatal problem in 2016 because education was quite a good predictor of people’s votes."
Kennedy said that since 2016, more polls have been weighting for educational attainment, but such changes haven’t been universal. "Have all the pollsters fixed this since then? Some have; many have not," she said.
If a poll does not weight for education, then the reader should beware. You can find that in the fine print.
Likely voter screens
Some polls survey all adults; others survey registered voters. Still others survey "likely voters." Deciding who is a "likely voter" is much trickier than it sounds.
The expansiveness of the poll matters; as Pew has noted, Trump’s approval rating has sometimes been higher in polls of likely voters than in polls of all U.S. adults. "If pollsters disagree on who constitutes a likely voter, than they will also disagree on who’s winning," the Washington Post’s Philip Bump recently wrote.
The "likely voter" category is loosely defined, so it can inspire confusion.
Typically, pollsters will try to determine who’s "likely" to vote by asking respondents a battery of questions, such as their past voting history and their intention to vote in the coming election. The list of screening questions varies by pollster.
"Everyone has a different definition for likely voters, and that can make a difference," said Jennifer Agiesta, CNN’s director of polling and election analytics.
The further you are from the election, the harder it is to accurately predict who’s likely to vote. "Likely voters are hard to define even before an election, but a year out it’s even harder," said Emily Swanson, Associated Press director of public opinion research.
Another challenge specific to the 2020 election is that most experts expect a historically high level of voter turnout. This means that past voting patterns may not be as predictive of who will be a likely voter for 2020 as in the past.
"Every indication we have is that 2020 turnout will be bonkers," CNN’s Agiesta said. "If you’re strictly limiting your likely voter model to someone’s past voting record, you are missing something."
Weighting for partisan identification
Here’s a method that pollsters strongly recommend against: weighting for partisan identification. That’s because the party that people identify with is less clear-cut than it would seem.
For instance, in Appalachia and parts of the South people have retained their Democratic Party registration even as they vote almost exclusively for Republicans, particularly in federal races. Meanwhile, for some voters, partisan identification is relatively fluid and can shift as the parties’ popularity evolves.
"Party affiliation is not a demographic characteristic like gender or race, which means people can change their affiliation based on what is going on in politics or because of other factors," Pew advises.
A related question is whether there is a "shy Trump voter" effect in polls. This is the notion that surveys underestimate Trump’s level of support because of social pressure not to reveal oneself as a Trump backer.
Polling experts say this theory is probably wrong: Rates of support for Trump have been similar in live-caller polls and online polls, and randomized experiments have shown no indication of this pattern.
Poll wording
In polling, words matter. Ask a question one way and you may get one answer; shade the wording differently, and you may get a different one.
According to industry standards, credible polls need to disclose their exact wording. (Other required disclosures include who sponsored the survey and who conducted it; a definition of the population being surveyed; dates the survey was in the field; how respondents were reached; and the number of respondents.)
We have previously looked at this phenomenon in the context of surveys that ask about "sanctuary cities."
In one poll, respondents were asked, "Should cities that arrest illegal immigrants for crimes be required to turn them over to immigration authorities?" On this question, 80% of respondents said yes.
But the experts we spoke to said the jurisdictions described as sanctuary cities don’t simply let murderers, rapists, armed robbers and other people they arrest for violent crimes go free. A bigger issue with such jurisdictions are lesser, nonviolent offenses, even down to a broken tail light or simply any interaction with police, such as an undocumented immigrant becoming a happenstance witness to a crime.
A different poll asked a more nuanced question: "Thinking about people who have immigrated to the U.S. illegally, who do you think should be deported: Should no illegal immigrants be deported, only illegal immigrants that have committed serious crimes, only illegal immigrants that have committed any crime, or should all illegal immigrants be deported?"
In this poll, 53 percent of respondents said deportations should only be done for "serious crimes," compared to 22 percent for "any crime."
Cherry-picking poll results
Looking at a broad pattern of recent polls is always better than looking at just one.
"I’m using the same strategy today that I’ve used since I️ started in this business," Amy Walter, national editor at the nonpartisan Cook Political Report, has told PolitiFact. "Take the highest and lowest polls, throw them out, and the result will be somewhere in the middle."
If a candidate is getting stronger or weaker over time in a series of polls, that’s a pattern worth watching.
A poll result that breaks with past polling deserves appropriate skepticism, but don’t preclude the possibility that an unusual result could be an early sign of a trend that simply hasn’t shown up yet in other polls.
A good example is a Monmouth University poll released in August 2019. While most surveys at that point in the Democratic presidential primary showed former Vice President Joe Biden as the clear frontrunner in the race, the Monmouth poll showed what was essentially a three-way contest for first place between Biden, Sen. Bernie Sanders and Sen. Elizabeth Warren.
At the time, polling experts warned that the results were not definitive, and the poll’s director, Patrick Murray, released a statement acknowledging that his survey was an outlier.
Over the next few weeks, however, other polls showed that the onetime outlier result was actually becoming the reality in the Democratic primary race.
Undecided voters
The percentage of voters who are undecided isn’t always shown in the newspaper or television graphics that summarize poll findings, but it’s important not to ignore them.
Undecided voters proved important in 2016, when both of the major-party presidential candidates had high unfavorable ratings, leaving some voters torn about who to vote for until late in the campaign — sometimes later than the final polls were taken. Exit polls showed that these "late deciders" broke to Trump by double-digit margins in key states, providing a key to Trump’s victory.
Generally speaking, incumbents can rest easier if they’re above 50% support in a given poll. If they’re below that, they’ll tend to have an uphill battle to reach a majority.
"Undecideds almost always break toward the challenger," Walter said. "It happened in 2016 to Trump."
Cell phone and internet polling
For years, pollsters have fretted that Americans are less and less willing to answer pollsters’ questions by phone. They are overwhelmed by junk robocalls and pressed for time. Credible pollsters have transitioned from calling only landlines to calling cell phones as well, but this isn’t a guarantee that the model will remain feasible.
The cost of phone-based polls "is going up," said David Dutwin, past president of the American Association for Public Opinion Research. "It now takes four times as many calls to complete a poll as it did a decade ago."
Even more problematic, Dutwin said, is that new generations of phones can send unknown numbers directly to voicemail. As a result, he said, "there's a real question of whether cell phone research is going to be viable in three years."
More polling is moving online. Internet polling, initially frowned upon by old-school pollsters, has gained trust and prominence in the polling industry. Experts say that the people who tend to join Internet panels look a lot like the electorate, and people who don’t join often coincide with populations that also don’t vote.
Internet-based polls recruit respondents in many ways, said Steven Smith, a political scientist at Washington University in St. Louis who runs one of his own. The most common way is by advertising for volunteers. A second way, more expensive but with stronger statistical foundations, involves a random sample from a source such as all residential addresses.
One example of a widely followed Internet-based poll is the CBS News/YouGov survey. One recent poll was conducted online with 16,525 registered voters in 18 states expected to hold early primaries and caucuses. The sample included 7,804 self-identified Democrats and Democratic-leaning Independents and was weighted for gender, age, race, and education, with a margin of error of 1.8 points.
The format has allowed CBS to model a wide variety of topics, from the race to control Congress to presidential approval ratings to the Democratic primary field.
"We are entering a new golden age for polling, if the tools are used properly," said Anthony Salvanto, CBS News elections and surveys director.
Our Sources
American Association for Public Opinion Research, "Margin of Sampling Error/Credibility Interval," accessed Nov. 4, 2019
American Association for Public Opinion Research, "An Evaluation of 2016 Election Polls in the U.S.," 2017
American Association for Public Opinion Research, "AAPOR Code of Ethics," accessed Nov. 4, 2019
Pew Research Center, "5 tips for writing about polls," Oct. 22, 2019
Pew Research Center, "A basic question when reading a poll: Does it include or exclude nonvoters?" Feb. 16, 2017
Pew Research Center, "Why public opinion polls don’t include the same number of Republicans and Democrats," Oct. 25, 2019
Washington Post, "The complex considerations undergirding 2020 polling," Nov. 4, 2019
CNN, "Polling director acknowledges recent Monmouth survey was an outlier," Aug. 28, 2019
The Atlantic, "Are Polls Skewed Too Heavily Against Republicans?" Sept. 25, 2012
Vox.com, "The state of the 2020 Democratic primary polls, explained," Aug. 28, 2019
PolitiFact, "How trustworthy are the polls, more than a year after the 2016 election?" Jan. 3, 2018
PolitiFact, "Andrew Yang's claim of support among Trump voters rates Pants on Fire," Oct. 24, 2019
PolitiFact, "Anatomy of a statistic: Do 80 percent of Americans oppose sanctuary cities?" Feb. 24, 2017
Email interview with Steve Smith, political scientist at Washington University in St. Louis, Nov. 4, 2019
Email interview with Emily Swanson, director of public opinion research at the Associated Press, Nov. 4, 2019
Email interview with David Dutwin, past president of the American Association for Public Opinion Research, Nov. 4, 2019
Email interview with Jennifer Agiesta, CNN’s director of polling and election analytics, Nov. 4, 2019
Email interview with Courtney Kennedy, director of survey research at the Pew Research Center, Nov. 4, 2019
Email interview with Anthony Salvanto, CBS News Elections & Surveys Director, Nov. 4, 2019


