Stand up for the facts!
Our only agenda is to publish the truth so you can be an informed participant in democracy.
We need your help.
I would like to contribute
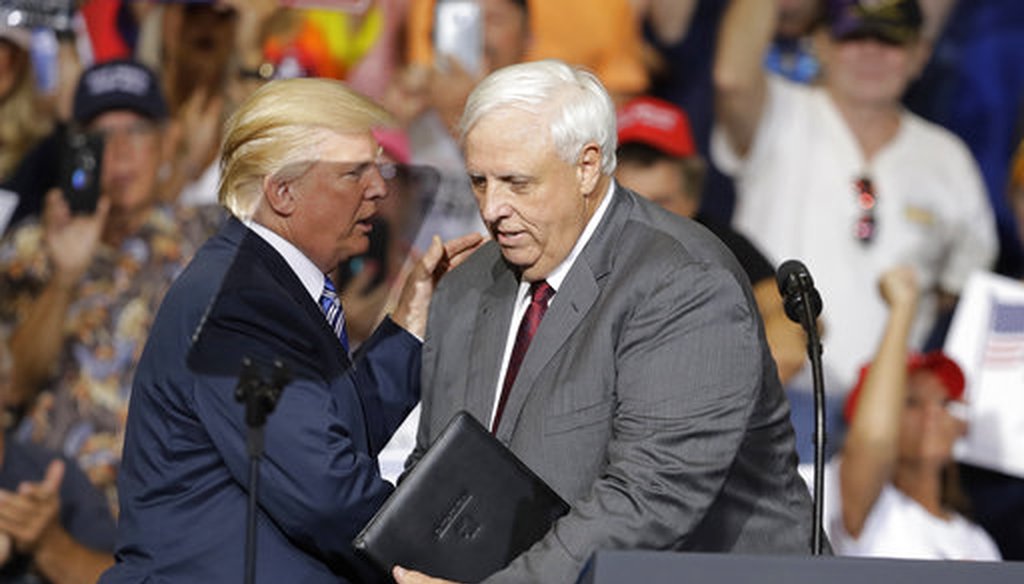
President Donald Trump talks with West Virginia Gov. Jim Justice during a rally on Aug. 3, 2017, in Huntington, W.Va. (AP)
President Trump has established a close relationship with West Virginia, the state that gave him his second-widest margin of victory in 2016.
On July 21, Trump tweeted a boast about the state’s recent economic success:
"The Great State of West Virginia is producing record setting numbers and doing really well. When I became President, it was practically shut down and closed for business. Not anymore!"
Because the tweet’s vague phrasing is hard to measure mathematically, we won’t be rating the statement on the Truth-O-Meter. Instead, we will look at some key economic factors to get a rough sense of whether the state’s economic performance has turned on a dime since 2017, the year that both Trump and his ally, Gov. Jim Justice, took office.
Broadly speaking, we found that the state’s economic performance has improved during that period -- but for several key statistics, that improvement continued the ongoing trend lines in place before Trump and Justice took office. (Justice was elected governor as a Democrat, but he switched to the Republican Party in 2017.)
For instance, here’s a look at the state’s unemployment rate since 2007. As with the other charts below, the red portions denote the tenures of Trump and Justice.
West Virginia’s unemployment rate in August 2019 was 4.6%, the lowest since the start of the Great Recession, and it has fallen from 5.3% in January 2017, when Trump and Justice took office.
However, as the chart shows, the state unemployment rate also fell under President Barack Obama and Justice’s Democratic predecessor, Gov. Earl Ray Tomblin. Indeed, the country’s unemployment rate as a whole has declined during that period, so this pattern was not unique to West Virginia.
We also looked at median household income in West Virginia:
This chart also shows good news for West Virginia -- modest gains above the rate of inflation in 2017 and 2018.
Here too, though, inflation-adjusted median income also rose in West Virginia in 2015 and 2016, before Trump or Justice took office. And the pattern in West Virginia was similar to what it was for the nation as a whole.
Here’s a look at food stamp use — one of the main statistics that measures the extent of poverty in the state and the nation.
The number of West Virginians on food stamps has declined since the start of 2017, which is positive news. However, the decline began several years before Trump and Justice took office, and it mirrors the pattern nationally.
Meanwhile, here’s a chart showing the change in quarterly gross domestic product for West Virginia. That’s a measure of all economic output in the state, compared to the previous quarter.
The quarterly GDP growth is good news, too, for West Virginia. In six quarters, the state saw an increase, compared to three quarters in which there was a decline. The quarterly increases ranged from about 2% to almost 10%.
That said, "it’s hard to attribute economic growth to any president’s policies," said Eric Bowen, an energy economics specialist at West Virginia University. "In the case of West Virginia’s economic growth, I think you would have to consider the trends prior to the changeover in administration."
Perhaps the most striking improvement occurred in the labor-force participation rate. This is a statistic that calculates the percentage of West Virginia’s civilian, non-institutionalized population that is either working or looking for work. Economists say that a higher percentage is always preferable because it shows that a smaller share of the population is unable or unwilling to work.
Here’s a chart showing West Virginia’s labor force participation rate since 2007, about a year before the Great Recession hit.
The chart shows that prior to 2017, West Virginia’s labor-force participation rate was generally falling or stagnant. But since early 2017, it has risen consistently, even if not to pre-recession levels.
This improvement is especially notable since the labor force participation rate for the country as a whole has been stable even as West Virginia’s has been rising.
However, it’s worth noting that after rough stability in population in the first half of the decade, West Virginia’s population shrank by about 25,000 people between 2016 and 2018. So while employment did increase, the rise in the labor force participation rate was magnified by the shrinkage in population.
Having a shrinking population "doesn't look so good for the economic outcomes in the state," said Tara Sinclair, a George Washington University economist.
Finally, we looked at data for a specific industry that has been a key focus of policy attention for both Trump and Justice — mining and resource extraction. Both Trump and Justice have advocated easing environmental and regulatory restrictions on the mining and oil and gas sectors. West Virginia ranks near the top nationally in coal and is also a significant natural gas producer.
This chart shows the amount of economic output every quarter from mining, quarrying, and oil and gas extraction in the state:
The economic output has been on an upward trajectory since the start of 2017, though it also rose — somewhat more gradually — for several years prior.
However, it’s worth noting that the recent gains for the extraction sector are limited. Here’s a chart showing the number of employees in the extraction sector:
In other words, the sector has gained a few thousand jobs since its low point in 2016, but its current level remains far below its pre-recession level and even well below its peak in late 2011 and early 2012.
"For a variety of reasons — mostly due to low natural gas prices and a falloff in coal exports — the election year of 2016 was a particularly bad year for the state’s coal mining industry, and we have seen some rebound since then," Bowen said. "But mining employment and production are still well below what they were as recently as 2011."
The bottom line
Key economic statistics show that West Virginia is on an upward course. The most impressive turnaround since Trump and Justice entered office has been in the labor force participation rate.
Other statistics also show gains during their tenures, but in many cases those continued the trend lines seen under their predecessors, calling into question how much credit either can claim for the economic progress.
Our Sources
Donald Trump, tweet, July 21, 2019
Federal Reserve Economic Data website
Bureau of Economic Analysis interactive data tool
U.S. Census Bureau, "Annual Estimates of the Resident Population for the United States, Regions, States, and Puerto Rico: April 1, 2010 to July 1, 2018," accessed Sept. 30, 2019
Bureau of Labor Statistics, West Virginia employment data, accessed Sept. 30, 2019
Email interview with Eric Bowen, research assistant professor at the West Virginia University Bureau of Business & Economics Research, Sept. 28, 2019
Email interview with Tara Sinclair, George Washington University economist, Sept. 30, 2019


