Stand up for the facts!
Our only agenda is to publish the truth so you can be an informed participant in democracy.
We need your help.
I would like to contribute
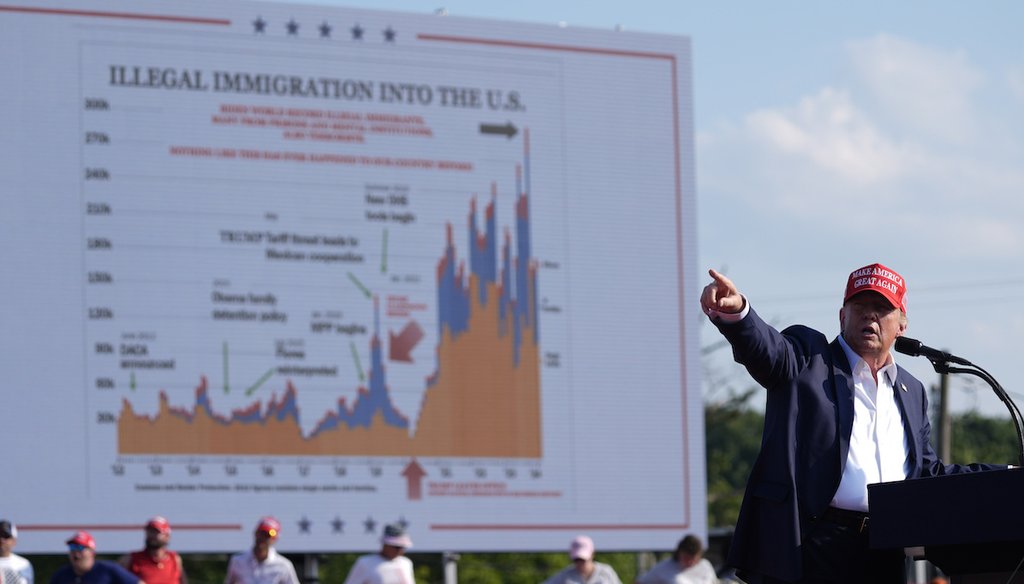
Republican presidential candidate former President Donald Trump speaks at a campaign rally July 13, 2024, in Butler, Pa. A graphic about immigration was displayed on screens at the rally. (AP)


Just before gunfire flew across former President Donald Trump’s campaign rally July 13, Trump turned his head to his right to look at a graphic shown on a big screen.
The graphic, titled "Illegal Immigration into The U.S.," saved his life, Trump told his former White House doctor, U.S. Rep. Ronny Jackson, R-Texas, the next day, according to The New York Times.
"He said, ‘If I hadn’t pointed at that chart and turned my head to look at it, that bullet would have hit me right in the head,’" Jackson said.
The assassination attempt against Trump during the Butler, Pennsylvania, rally killed one Trump supporter and injured two others.
Trump’s attention to the graphic may have changed history. So, we wanted to take a closer look at what it said.
Where did the graphic originate?
The chart originated on Sen. Ron Johnson’s, R-Wis., website in a March posting about border security. Midway down the webpage, it’s headlined, "Biden's Border Crisis."
Trump added to Johnson’s graphic, which can be seen in this New York Times photo from the rally. We found a cleaner image of Trump’s graphic on an April article by FactCheck.org, which said that Trump used the graphic at an April 2 Green Bay, Wisconsin, rally and that the chart was misleading. Trump also shared the chart in a May Truth Social post.
We reached out to teams for both Trump and Johnson but they did not respond with evidence. Speaking about the role the graphic played in assassination attempt, Johnson told Fox News’ Bret Baier that he had been developing the chart since 2014. He showed it to Trump before the Green Bay rally and Trump’s team made some changes and it has been using it ever since, Johnson said: "I’m happy to have been of service there."
Johnson’s original graphic shows monthly southwest border encounters at and between ports of entry from 2012 to 2024, citing U.S. Customs and Border Protection data. We checked the monthly figures against the Homeland Security Department’s data and those monthly figures appear accurate, although the Johnson graphic doesn’t show exact numbers.
But Trump added some words and arrows to the chart that are wrong and misleading in several ways. Trump’s chart included a big red arrow pointing to a low migrant encounter total during the coronavirus pandemic in April 2020, falsely claiming that was when he left office. Trump left office in January 2021.
Prisoners, mental patients and terrorists
The chart that Trump’s campaign showed the Butler, Pennsylvania, rally crowd also claimed in red letters at the top: "Biden world record illegal immigrants, many from prisons and mental institutions, also terrorists. Nothing like this has ever happened to our country before!"
Trump often riffs on this idea at his rallies and with reporters. PolitiFact rated Trump’s May 29 claim that "millions" of immigrants from jails, prisons or mental institutions came under Biden Pants on Fire. The rally graphic’s language is more general by saying that "many" were from prisons and mental institutions or terrorists.
Immigration experts have told PolitiFact that there is no evidence that people released from prisons or mental institutions are coming to the U.S. in large numbers.
Immigration officials arrested about 110,000 noncitizens with criminal convictions (whether in the U.S. or abroad) from fiscal year 2021 to 2024, Customs and Border Protection data shows. Fiscal years run from October to September, so that includes about four months of Trump’s administration.
The data shows there were 63,869 such arrests from fiscal years 2017 to 2020, which covers Trump’s administration plus about four months under Obama.
Not all of the people arrested were let into the country. The term "noncitizens" includes people who may have had legal immigration status in the U.S. but were not U.S. citizens. The data reflects the people that the federal government knows about, but it’s inexhaustive. Some countries don’t share their criminal databases with the U.S.
Experts said many people in Latin American countries face barriers to mental health treatment, so if patients are coming to the U.S., they are probably coming from their homes, not psychiatric hospitals.
There was a slight increase in the number of migrants arrested at the southern border who are on the U.S. terrorist watchlist over the past year, a Department of Homeland Security assessment shows.
As to whether a world record of illegal immigration was set under Biden, Michelle Mittelstadt, communications director of the Migration Policy Institute, a nonpartisan think tank, said her organization is "unaware of any authoritative data on irregular migrant stocks by country."
Border patrol encounters with people illegally crossing the U.S.-Mexico border reached a U.S. high in December 2023.
Graphic mischaracterizes data when Trump left office
At the chart’s bottom, a big red arrow points to April 2020, when immigrant encounters at the southwest border dipped to 17,110.
Words next to the arrow read, "Trump leaves office. Lowest illegal immigration in recorded history."
"So, that’s when I left office," Trump told the crowd shortly before the shooting, pointing out the chart’s red arrow. "That arrow is the lowest amount of illegal immigration ever in recorded history into our country. And then, the worst president in the history of our country took over and look what happened to our country."
But the arrow points to a decline in immigration encounters at the beginning of the coronavirus pandemic, when migration overall significantly dropped as nations imposed lockdowns. Trump left office nine months later, when Biden took over Jan. 20, 2021. Recorded encounters at the southwest border rose each month after April 2020, reaching 73,990 in December, Trump’s last full month in office.
The steady rise in border encounters in Trump’s last year "reflects the reality that the Migrant Protection Protocols (aka Remain in Mexico) and other border policies were not as effective in reducing irregular migration as claimed," Mittelstadt wrote in an email.
The Remain in Mexico program sent some migrants seeking asylum to Mexico to await their immigration court proceedings.
Trump was also wrong about April 2020 having the lowest illegal immigration in recorded history.
Looking at yearly totals dating to 1925, no year in Trump’s tenure had the lowest number of encounters in history. The lowest yearly total was 10,319 in 1934, when Franklin D. Roosevelt was president, CBP data shows. Total illegal immigration during Trump’s administration was higher than under each of former President Barack Obama’s terms, which ran from January 2009 to January 2017.
There were fewer encounters in March (16,590) and April (15,770) of 2017, during Trump’s first year, than April 2020.
Pandemic effect
The Trump graphic also omits that April 2020 was in the height of the COVID-19 pandemic, when many countries, including the U.S., restricted travel.
"The pandemic was responsible for a near-complete halt to all forms of global mobility early in 2020, due to a combination of border restrictions imposed by countries around the world alone, lockdowns, and the shutdown of aviation and other transportation routes," Mittelstadt said.
The Migration Policy Institute recorded more than 43,000 travel measures by countries from January to May 2020.
Also, it’s difficult to fairly compare data before the COVID-19 pandemic to data since.
Before the pandemic, border officials recorded apprehensions of people trying to cross the border illegally under immigration law. But in March 2020, Trump began using Title 42, an emergency health authority that let the government quickly expel migrants to prevent COVID-19’s spread. During that time, the government changed how it reported illegal immigration.
From March 2020 onward, the U.S. began reporting encounters, a combination of apprehensions and Title 42 expulsions. People expelled under the public health policy faced no legal consequences for repeatedly trying to enter the U.S. illegally. Immigration experts say that encouraged migrants to try over and over to cross. (Under immigration law, people can face legal penalties for repeat illegal entries.)
Encounters data represent the number of times officials stopped immigrants, not the number of individual immigrants stopped. If one person tries crossing the border three times, for example, that’s recorded as three encounters.
A PolitiFact review found that, accounting for challenges in data comparisons, illegal immigration increased 300% from Trump’s first full month in office to his last.
Our Sources
Wisconsin Sen. Ron Johnson, Crisis at the Border, March 2024
Email interview, Michelle Mittelstadt, communications director of the Migration Policy Institute, July 17, 2024
Jason Calvi, X post with video of Fox News interview with Ron Johnson, July 14, 2024
NewsMax, 'God works in mysterious ways': Sen. Ron Johnson, July 16, 2024
Real America’s voice, X post with video of Ron Johnson interview, July 15, 2024
Office of Homeland Security Statistics, Immigration Enforcement and Legal Processes Monthly Tables, accessed July 17, 2024
U.S. Customs and Border Statistics, CBP Enforcement Statistics, accessed July 17, 2024
PolitiFact, Pence’s claim about a 90% drop in illegal immigration during Trump administration is wrong, Dec. 6, 2022
PolitiFact, 2024 presidential debate fact-check: How accurate were Joe Biden, Donald Trump?, June 28, 2024
PolitiFact, FBI director never said Hamas militants can walk right into the U.S. through the southern border, Jan. 8, 2024
PolitiFact, Trump’s ridiculous claim that "millions" of immigrants came illegally from jails, mental facilities, June 6, 2024
PolitiFact, Donald Trump exaggerates Venezuelan crime drop and misleads on root causes, April 10, 2024
PolitiFact, No evidence for Donald Trump’s claim that Congo is releasing people from jail into the U.S., June 12, 2024
Factcheck.org, Trump’s Misleading Chart on Illegal Immigration, April 4, 2024
Washington Post, A look at Trump’s misleading, inaccurate graph of U.S. immigration, May 23, 2024