
Our only agenda is to publish the truth so you can be an informed participant in democracy.
We need your help.


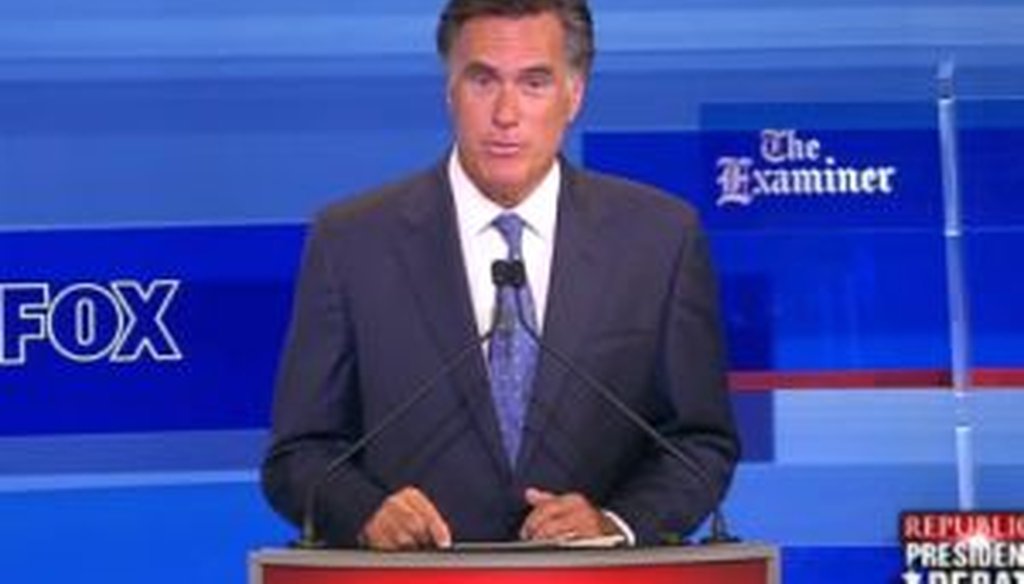
Former Massachusetts Gov. Mitt Romney was one of eight candidates to take part in a debate in Ames, Iowa, on Aug. 11, 2011.
During the Republican presidential debate in Ames, Iowa, on Aug. 11, 2011, former Massachusetts Gov. Mitt Romney offered statistics designed to show how much the federal government had grown over the past five decades.
Romney said that "back in the days of John F. Kennedy, the federal government took up, along with the state and local governments, 27 percent of the economy. Today, government consumes 37 percent of the economy. We're inches away from no longer having a free economy."
We separately checked the claim that "we're inches away from no longer having a free economy" here. So for this item, we’ll focus on his statistical comparison.
We found that the numbers Romney cited were close to correct -- but he also left out some important context.
The Office of Management and Budget produces a table every year that tracks total government expenditures as a percentage of gross domestic product. Here are the statistics for the years in question:
Fiscal year 1961: 27.4 percent
Fiscal year 1962: 27.8 percent
Fiscal year 1963: 27.7 percent
Fiscal year 2009: 36.5 percent
Fiscal year 2010: 35.0 percent
Romney’s figures aren’t exact -- he could have said 28 percent under Kennedy rather than 27 percent, and 35 percent today rather than 37 percent, making it a rise of seven percentage points rather than 10. But he’s got the general trend correct.
However, using only the big-picture numbers is only part of the story. Digging deeper into the numbers provides a much fuller sense of what’s going on. For simplicity, we’ll choose the 1963 and 2010 figures for a more detailed analysis. Once again, the listed figures are expressed as a percentage of GDP and are rounded.
1963
Federal expenditures for defense and international accounts: 9.8 percent
Federal net interest expenditures: 1.5 percent
Federal Social Security and Medicare expenditures: 2.6 percent
Federal payments to individuals exclusive of Social Security and Medicare: 2.6 percent
Federal spending in all other categories: 2.3 percent
State and local government: 8.9 percent
Total: 27.7 percent
2010
Federal expenditures for defense and international accounts: 5.1 percent
Federal net interest expenditures: 1.4 percent
Federal Social Security and Medicare expenditures: 8.4 percent
Federal payments to individuals exclusive of Social Security and Medicare: 7.3 percent
Federal spending in all other categories: 1.6 percent
State and local government: 11.1 percent
Total: 35.0 percent
So let’s look at the components of government that expanded and contracted between 1963 and 2010.
Defense spending was cut almost in half as a percentage of GDP, as was "other spending." Net interest barely budged, while state and local government increased by about one-fifth.
But the big increases came from two categories: Social Security and Medicare, which more than tripled as a share of GDP, and other federal payments to individuals, which fell slightly short of tripling.
First, we should note that Medicare didn’t exist until 1965, so a big share of the increase Romney pointed to stems from this single program.
More important, there’s something that ties together all of these fast-growing expenditures: They are all payments made by the government to individuals.
Why is this important? It’s a question of control, says Gary Burtless, an economist with the centrist-to-liberal Brookings Institution.
These transfer payments, as they are known, "can be more or less freely spent by private individuals," Burtless said. "Your mom can spend her Social Security check any way she wants -- on food, shelter, vacations at Disney World or deposits in her bank account or her favorite mutual fund. Even cash public assistance recipients have pretty wide freedom over how they spend their welfare checks."
Some transfer payments are more restrictive, such as food stamps or Medicare and Medicaid benefits, but these still allow some degree of consumer choice.
"This distinction is important for a simple reason," Burtless said. While lawmakers and government officials have direct say over many types of government expenditures, "their say over government transfers is a lot more restricted."
In addition, he said, many government transfer payments "are paid for with earmarked taxes – FICA and unemployment insurance taxes. When we get transfers from the government under Social Security, Medicare and unemployment insurance, we’re getting back the money that we or our employers contributed when we were working."
While these are undoubtedly government expenditures, one could argue that they are actually pass-throughs of payments from the American public to itself. And it’s worth noting that Social Security and Medicare -- the drivers of government growth -- are among the most popular of all government programs.
So how would taking this into account change the equation? If you subtract the share for federal transfer payments from figures above, it turns out that government spending as a percentage of GDP actually declined between 1963 and 2010, from 22.5 percent to 19.3 percent.
And this trend is confirmed if you use a different data set. The Bureau of Economic Analysis publishes statistics that break down the components of national GDP. If you take the category "government consumption expenditures and gross investment" for all levels of government -- a figure that doesn’t include transfer payments -- and divide it by GDP, government accounted for 22.0 percent of GDP in 1963 and 20.7 percent of GDP in 2010.
So Romney’s numbers are nearly correct, but they don’t tell the whole story.
Yes, government spending has risen as a share of GDP, but the actual control on spending exerted by government has not risen by anywhere near that amount, because the bulk of the growth has come in transfer payments that individual Americans ultimately control (and, in many cases, under programs which they had paid into to begin with). On balance, we rate Romney’s statement Mostly True.
Fox News, Republican candidates debate, Aug. 11, 2011, accessed via CQ (subscribers only)
Office of Management and Budget, "Table 15.5—Total Government Expenditures by Major Category of Expenditure as Percentages of GDP: 1948–2010," accessed Aug. 12, 2011
U.S. Department of Commerce Bureau of Economic Analysis, National Income and Product Accounts Table 1.1.5. -- Gross Domestic Product, accessed Aug. 12, 2011
PolitiFact, "Mitt Romney gets another Pants on Fire for saying we're 'inches away' from not being capitalist any more," Aug. 12, 2011
Washington Post, "Fact checking the GOP debate in Iowa" (Glenn Kessler’s "The Fact Checker" blog), Aug. 12, 2011
E-mail interview with Gary Burtless, senior fellow at the Brookings Institution, Aug. 12, 2011
In a world of wild talk and fake news, help us stand up for the facts.
