
Our only agenda is to publish the truth so you can be an informed participant in democracy.
We need your help.


Rick Santorum waves to the crowd as he is introduced at the start of a Republican presidential debate on Feb. 22, 2012, in Mesa, Ariz.
During the Feb. 22, 2012, presidential debate in Mesa, Ariz., Rick Santorum offered some historical comparisons of the federal budget.
"When I was born" -- which was 1958 -- "less than 10 percent of the federal budget was entitlement spending. It's now 60 percent of the budget. Some people have suggested that defense spending is the problem. When I was born, defense spending was 60 percent of the budget. It's now 17 percent. If you think defense spending is the problem, then you need a remedial math class to go back to."
We’ll split these claims into two separate items. Here, we’ll look at whether in 1958, "less than 10 percent of the federal budget was entitlement spending. It's now 60 percent of the budget."
We turned to data from the Office of Management and Budget. OMB provides historical figures for federal payments to individuals, including payments for such entitlement programs as Social Security and Medicare.
In 1958, such payments accounted for 25.4 percent of the federal budget -- more than double what Santorum said.
In fiscal year 2011, the comparable percentage was 65.1 percent, which is in the ballpark for what Santorum claimed.
This growth is not too surprising, since Medicare and Medicaid were signed into law in 1965 -- when Santorum was 7 years old -- and now occupy an increasing share of the federal budget. During that time, the U.S. population has grown significantly, as well.
Our ruling
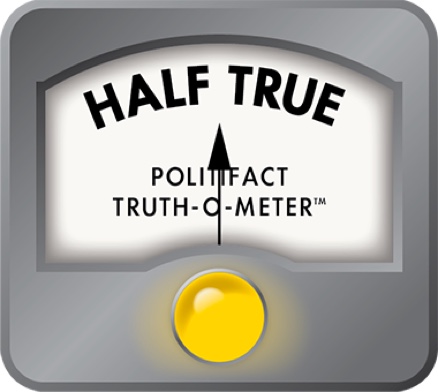
Santorum is close on the current percentage of the federal budget going to entitlements, but he understates the figure for his birth year. This makes the expansion, which is dramatic in any case, seem even more so. With one statistic right and one wrong, we rate the claim Half True.
Office of Management and Budget, "Table 11.1—Summary Comparison of Outlays for Payments for Individuals: 1940–2017 (In Current Dollars, as Percentages of Total Outlays, as Percentages of GDP, and in Constant (FY 2005) Dollars)," accessed Feb. 22, 2012
Office of Management and Budget, Table 1.1—Summary of Receipts, Outlays, and Surpluses or Deficits (-): 1789–2017, accessed Feb. 22, 2012
Office of Management and Budget, Table 11.2—Functional Composition of Outlays for Payments for Individuals: 1940–2017, accessed Feb. 22, 2012
Email interview with Steve Ellis, vice president at Taxpayers for Common Sense, Feb. 23, 2012
In a world of wild talk and fake news, help us stand up for the facts.
