
Our only agenda is to publish the truth so you can be an informed participant in democracy.
We need your help.


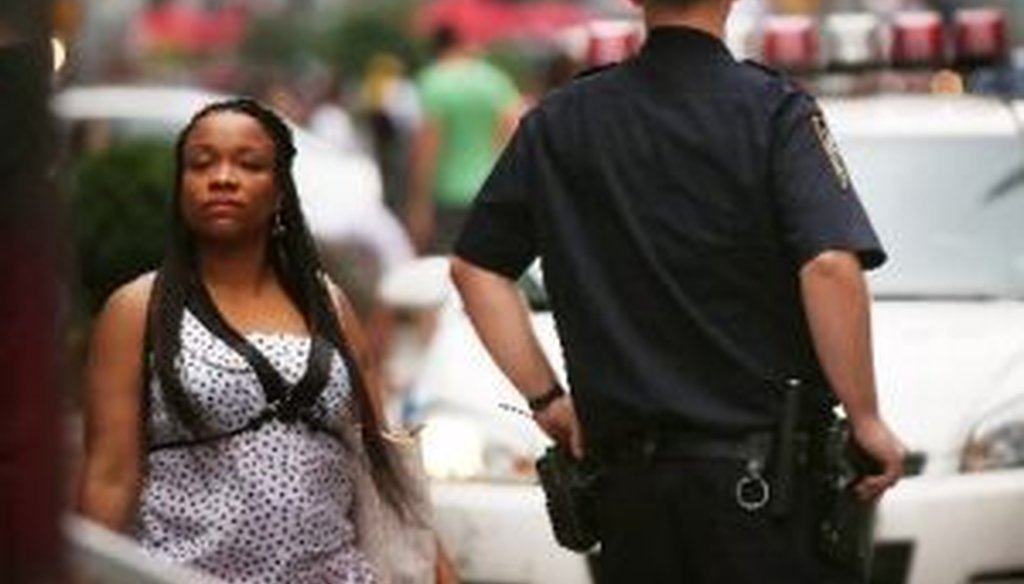
A woman walks by a New York City police officer in Times Square, shortly after the city's "stop and frisk" policy in high crime neighborhoods was given a severe rebuke.
Following a federal court decision rebuking New York City’s "stop-and-frisk" policy as racially discriminatory, Mayor Michael Bloomberg penned a Washington Post op-ed titled, "‘Stop and frisk’ is not racial profiling."
He began the op-ed with a strong defense of the policy -- namely, that it works.
"New York is the safest big city in the nation, and our crime reductions have been steeper than any other big city’s," Bloomberg wrote. He said the improvements are due in large part to the policy, in which police officers stop and search people they suspect might be involved in criminal activity.
We won’t address the wisdom of the policy, which is the focus of intense debate. Instead, we’ll look at the question of whether "New York is the safest big city in the nation, and our crime reductions have been steeper than any other big city’s."
The numbers: Is New York the safest big city?
We turned to the most recent full-year data from the FBI, which used 2011 figures. Since a previous NYPD news release had compared New York City to both the 10 biggest cities and the 25 biggest cities, we will use those parameters here as well. In the charts below, violent crimes include murder and nonnegligent manslaughter; forcible rape; robbery; and aggravated assault. Property crimes include burglary, larceny-theft and motor vehicle theft.
The following chart lists the 25 largest cities in America, in descending order by population. The last two columns show where the city ranks by crime rate, with 1 being the lowest crime rate.
City
Violent crimes, 2011
Property crimes, 2011
Total crimes
Total crime rate per 100,000 pop.
Rank by lowest crime rate among 10 biggest cities
Rank by lowest crime rate among 25 biggest cities
New York
8,244,910
51,209
140,457
191,666
2,324
1
1
Los Angeles
3,819,702
20,045
86,330
106,375
2,785
4
4
Chicago
2,707,120
NA
118,239
NA
NA
--
--
Houston
2,145,146
20,892
108,336
129,228
6,024
9
18
Philadelphia
1,536,471
18,268
59,617
77,885
5,069
7
12
Phoenix
1,469,471
8,089
64,479
72,548
4,937
5
10
San Antonio
1,359,758
7,038
80,868
87,906
6,465
10
20
San Diego
1,326,179
5,104
29,709
34,813
2,625
3
3
Dallas
1,223,229
8,330
61,859
70,189
5,738
8
17
San Jose
967,487
3,206
21,972
25,178
2,602
2
2
Jacksonville
827,908
5,182
36,113
41,295
4,987
6
11
Indianapolis
827,609
9,170
46,967
56,137
6,783
--
21
Austin
820,611
3,471
42,250
45,721
5,572
--
14
San Fran.
812,826
5,374
32,886
38,260
4,707
--
8
Columbus
797,434
5,185
49,043
54,228
6,800
--
22
Fort Worth
758,738
4,569
35,117
39,686
5,231
--
13
Charlotte
751,087
4,787
32,008
36,795
4,899
--
9
Detroit
706,585
15,245
43,818
59,063
8,359
--
24
El Paso
665,568
2,858
16,312
19,170
2,880
--
5
Memphis
652,050
10,336
42,355
52,691
8,081
--
23
Boston
625,087
5,252
19,445
24,697
3,951
--
6
Seattle
620,778
3,664
31,792
35,456
5,712
--
15
Denver
619,968
3,708
22,495
26,203
4,227
--
7
Baltimore
619,493
8,885
29,824
38,709
6,248
--
19
Washington
617,996
6,985
28,312
35,297
5,712
--
15
So by this measure -- violent crimes plus property crimes, adjusted for population -- New York City did record the lowest crime rate among the 10 biggest cities and also among the 25 biggest cities, making Bloomberg right.
The numbers: A steeper crime reduction than any other big city?
The FBI website has comparable crime data going back to 1995, so we looked at the change in each of these cities between 1995 and 2011.
Once again, we list the 25 largest cities in America, in descending order by population. The last two columns show where the city ranks by reduction in the total crime rate between 1995 and 2011, with 1 being the biggest reduction in the crime rate.
City
Total crime rate per 100,000 pop., 1995
Total crime rate per 100,000 pop., 2011
Percent increase or decrease, 1995-2011
Rank by biggest crime decrease among 10 biggest cities
Rank by biggest crime decrease among 25 biggest cities
New York
6,076
2,324
- 62 percent
2
2
Los Angeles
7,680
2,785
- 64 percent
1
1
Chicago
NA
NA
NA
--
--
Houston
7,588
6,024
- 21 percent
9
22
Philadelphia
7,078
5,069
- 28 percent
8
19
Phoenix
10,880
4,937
- 55 percent
3
5
San Antonio
7,994
6,465
- 19 percent
10
23
San Diego
5,548
2,625
- 53 percent
4
8
Dallas
9,464
5,738
- 39 percent
7
14
San Jose
4,387
2,602
- 41 percent
6
13
Jacksonville
9,001
4,987
- 45 percent
5
11
Indianapolis
4,460
6,783
+ 52 percent
--
24
Austin
8,132
5,572
- 31 percent
--
17
San Fran.
8,190
4,707
- 43 percent
--
12
Columbus
9,192
6,800
- 26 percent
--
20
Fort Worth
8,617
5,231
- 39 percent
--
14
Charlotte
9,576
4,899
- 49 percent
--
9
Detroit
1,1939
8,359
- 30 percent
--
18
El Paso
7,063
2,880
- 59 percent
--
3
Memphis
10,514
8,081
- 23 percent
--
21
Boston
9,493
3,951
- 58 percent
--
4
Seattle
10,482
5,712
- 46 percent
--
10
Denver
6,873
4,227
- 38 percent
--
15
Baltimore
13,323
6,248
- 53 percent
--
6
Washington
12,166
5,712
- 53 percent
--
6
By this measure, New York ranks second, by a narrow margin, to Los Angeles. Marc LaVorgna, a spokesman for Bloomberg, said that New York does rank first if you go back to 1993, when the city introduced its data-based policing approach, and he cited a 2011 book by University of California-Berkeley law professor Franklin E. Zimring, The City that Became Safe: New York's Lessons for Urban Crime and Its Control.
We checked with Zimring, who agreed that Bloomberg is on safe ground with his claim. Zimring said the steepest declines occurred in the early 1990s and would not have been captured entirely in our data. New York City’s drop "is the steepest ever for a major U.S. city with a credible statistics program," Zimring said.
Are such comparisons valid?
So, judging by the numbers, Bloomberg is on target. But is he justified in making a multi-city comparison, or is that just comparing apples to oranges? While everyone does it, experts say it can be a blunt measurement.
The FBI -- the source of the statistics Bloomberg used -- is one of the strongest voices warning that city-to-city comparisons are invalid. Here are a few of the factors that the FBI and other experts cite:
• No two cities are alike. Bloomberg’s preferred ranking consists of cities (which would not include separately incorporated suburbs) rather than metropolitan areas (which would include suburbs). In addition, New York includes the primarily suburban borough of Staten Island.
• Crime reporting rates can vary by city. Whether due to police habits or citizens' actions, different cities may not have the same level of diligence in reporting crimes, especially for the most numerous type of violent crime (aggravated assault) and the most numerous type of property crime (larceny-theft).
• Using total crime as the measurement mixes both violent and property crime. The method Bloomberg used counts every violent crime and property crime equally, so every murder is statistically equivalent to every car theft. Changing the category being calculated can make a big difference. In 2011, New York City had a better overall crime rate than Los Angeles, but New York had a higher violent crime rate -- 621 violent crimes per 100,000 population, compared to 524 for Los Angeles.
Still, despite some concerns about Bloomberg’s use of the statistics in this way, the criminologists we checked with agreed that the mayor has something to crow about.
"One thing that is quite obvious is that almost every neighborhood in the five boroughs can be said to be on the way up, whereas cities like Detroit, Chicago, Baltimore and St. Louis have quite a few neighborhoods that can be termed dead or dying," said Eugene O’Donnell, criminologist at the John Jay College of Criminal Justice.
James Alan Fox, a criminologist at Northeastern University, agreed. "New York has done a great job," he said. "But urban one-upmanship does no one any good. Whether they’re first, second or third in the nation is splitting hairs."
Our ruling
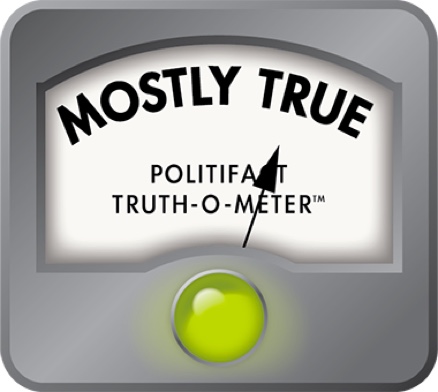
Bloomberg said, "New York is the safest big city in the nation, and our crime reductions have been steeper than any other big city’s." Both the FBI and criminologists express concern about making this type of multi-city comparison, and other measures, such as violent crime, don’t put New York at the No. 1 slot. Still, the numbers do broadly back up his claim. We rate the claim Mostly True.
Michael Bloomberg, "‘Stop and frisk’ is not racial profiling" (Washington Post op-ed), Aug. 18, 2013.
New York Police Department, "Mayor Bloomberg and Police Commissioner Kelly Announce New York City Remains the Safest Big City in America According to FBI Uniform Crime Report" (news release), Sept. 13, 2010
FBI, Crime in the United States, Table 8: Offenses Known to Law Enforcement by State and City, 2011
FBI, Crime in the United States, 1995
Baruch College, "Top 100 U.S. Cities ranked by Population, 2011 estimates"
Government Technology, "New York City Safest Big City in America, FBI Report Finds," June 9, 2008
Wall Street Journal, "Judge Rules NYPD Stop-and-Frisk Practice Violates Rights," Aug. 12, 2013
Christian Science Monitor, "Stop-and-frisk: NYC council overrides Bloomberg vetoes, curbing policy," Aug. 22, 2013
Time, "Viewpoint: What NYPD Really Needs: Polite Police" (column by Franklin E. Zimring), Aug. 13, 2013
Email interview with Franklin E. Zimring, law professor at the University of California-Berkeley, Aug. 23, 2013
Email interview with Eugene O’Donnell, criminologist at the John Jay College of Criminal Justice, Aug. 23, 2013
Interview with James Alan Fox, criminologist at Northeastern University, Aug. 26, 2013
Email interview with Marc LaVorgna, spokesman for Michael Bloomberg, Aug. 23, 2013
In a world of wild talk and fake news, help us stand up for the facts.
