

Democratic presidential candidate Martin O'Malley speaks to supporters at his campaign headquarters in Des Moines, Iowa, on May 30, 2015.
Martin O’Malley, the former governor of Maryland and mayor of Baltimore, threw himself into the Democratic presidential contest on May 30, 2015. He begins the race well behind frontrunner Hillary Clinton, but in his announcement speech, he hit some populist notes that sought to separate himself from the political and economic status quo.
"Today in America," he said, "70 percent of us are earning the same or less than we were 12 years ago, and this is the first time that that has happened this side of World War II. Today in America, family-owned businesses and farms are struggling to compete with ever larger concentrations of corporate power. … The American dream seems for so many of us to be hanging by a thread."
We wondered whether it was true that "70 percent of us are earning the same or less than we were 12 years ago," and if that’s happening for the first time since World War II.
When we checked with O’Malley’s staff, they initially pointed to data from the Economic Policy Institute, a liberal think tank. The group looked at the increase or decrease for hourly wages by percentile. That is, it grouped all wage earners into 10 equal categories -- the bottom 10 percent of earners, the next 10 percent, and so on. Using that data, it’s possible to calculate the percentage increase or decrease in adjusted wages over a given 12-year period.
If you look at the EPI data from 2002 to 2014, then each grouping up to and including the 70th percentile saw its inflation-adjusted income decline.
That supports the first part of O’Malley’s claim. The second part of his claim -- that "this is the first time that that has happened this side of World War II" -- is less clear.
EPI sent us data going as far back as 1973, and just using that more limited data period, we found two separate 12-year periods during which the bottom 70 percentile groups all lost ground or saw no change -- from 1973 to 1985, and from 1979 to 1991.
So, using the EPI data set at least, it’s not unprecedented since World War II for the bottom 70 percent to see incomes universally flat or declining.
The O’Malley campaign also pointed to raw data from the Census Bureau. This data breaks the income spectrum into five categories (rather than 10, as EPI did) and it begins in 1947 and runs through 2013.
This data set supports O’Malley’s general point: For only three 12-year periods does the bottom 80 percent of the income scale experience a decline or no change in inflation-adjusted income, and they’re the three most recent periods. Those are 1999 to 2011, 2000 to 2012, and 2001 to 2013.
However, this data set does not appear to be the source of O’Malley’s original "70 percent" claim, since the Census Bureau didn’t break down the data to the 70th percentile level, only to the 60th or the 80th percentile.
One additional note: O’Malley hasn’t described the data in the most accurate way. Saying that "70 percent of us are earning the same or less than we were 12 years ago" suggests that the data looks at whether specific individuals have seen their wages go up or down. This is known as "longitudinal data," and such data exists (though, due to the complexity of tracking individuals for years on end, it tends to be more limited).
Why does this matter? From one year to the next, it’s common for people to jump around from one percentile group to another. The EPI data and the census data miss the income changes these people experience -- the data doesn’t show how specific individuals did over time, but rather how entire percentile groups did from year to year. As a result, we simply don’t know how specific individuals saw their income rise or fall over that period. Maybe this would push O’Malley’s figure higher or lower; the important thing is, we simply don’t know.
Our ruling
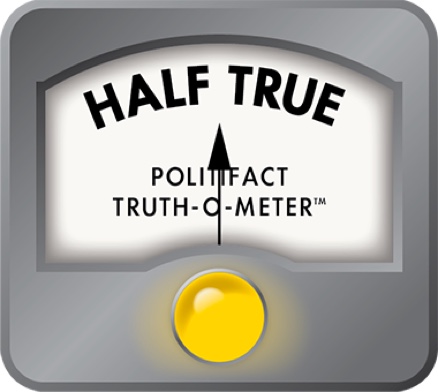
O’Malley said that "today in America, 70 percent of us are earning the same or less than we were 12 years ago, and this is the first time that that has happened this side of World War II."
His overall point is valid -- wages did go down or stay the same for the bottom 70 percent between 2002 and 2014. However, using the same data set that makes this part correct, there are at least two earlier 12-year periods that show the same pattern going back to 1973. This undercuts O’Malley’s claim that this is unprecedented going back to World War II. On balance, we rate the claim Half True.
Martin O'Malley, presidential campaign announcement in Baltimore, May 30, 2015
Economic Policy Institute, "Raising America’s PayWhy It’s Our Central Economic Policy Challenge," June 4, 2014
Email interview with Gary Burtless, senior fellow at the Brookings Institution, June 1, 2015
Email interview with Tara Sinclair, economist at George Washington University, June 1, 2015
Interview with Lawrence Mishel, president of the Economic Policy Institute, June 1, 2015
Email interview with Haley Morris, spokeswoman for Martin O’Malley, June 1, 2015
In a world of wild talk and fake news, help us stand up for the facts.
