Stand up for the facts!
Our only agenda is to publish the truth so you can be an informed participant in democracy.
We need your help.
I would like to contribute
Instagram graph misleads on the racial breakdown of homicides
If Your Time is short
-
The bar graph has been around since 2017. Its source is purportedly the FBI’s 2013 crime data.
-
While white-on-black murders were the smallest category of homicide in 2013, the graph underrepresents the incidence of white-on-white murders, which were the largest category. Experts say most murders are intraracial.
-
The graph doesn’t take into account the fact that, given their population size, black Americans are disproportionately killed by civilians and police.
Over the past few weeks, millions of people around the country have protested police brutality against black Americans. But a recent Instagram post says violence against African Americans isn’t as big a problem as activists say it is.
On June 17, an account called Casual Libtard published a bar graph that purports to break down murders by race. The smallest bar, labeled "0.77," is for blacks killed by whites.
"Black Lives Matter is b****ing about this?" reads the title of the graph.
The post was flagged as part of Facebook’s efforts to combat false news and misinformation on its News Feed. (Read more about our partnership with Facebook, which owns Instagram.) It has more than 5,500 likes, and the same graph has been widely shared in conservative Facebook groups.
We’ve previously fact-checked graphs and statistics that mislead on the racial breakdown of homicides and "black on black" crime. So we wanted to take a closer look at this bar graph, which has been around since at least September 2017, when it was published on a meme-making website.
Sign up for PolitiFact texts
We’re not sure what the numbers on the bar graph mean or what units they use, but the post is misleading in its comparison of four categories of homicides.
While white-on-black murders were the most infrequent kind of homicide in 2013, the year the graph cites, the post underrepresents the proportion of white-on-white murders. It also doesn’t take into account the fact that, given their population size, black Americans are disproportionately killed by civilians and police.
Graph distorts FBI crime stats
The purported source of the graph is a data table in the 2013 FBI Crime Report, which breaks down homicides by race. The graph correctly shows white-on-black murders are the rarest kind of homicide, but it misrepresents the relative frequency of white-on-white murders.
According to the FBI’s 2013 data, whites killed by whites constituted the largest proportion of all homicides. The Instagram post wrongly suggests that black-on-black murders are five times more frequent than white-on-white murders. In 2013, they were about 11% less frequent.
The data confirm what homicide researchers have long known: most murder cases in which the race of the killer and the victim are known are intraracial — that is, they are of the same race. This was the case in 2013, according to FBI data.
"Homicides overwhelmingly happen among people who know each other," David M. Kennedy, director of the Center for Crime Prevention and Control at John Jay College of Criminal Justice, previously told PolitiFact. "There are relatively few absolutely straight-up stranger homicides. Homicide is a phenomenon of social networks. ... Most people’s relationships are primarily with someone of their own race or ethnicity. As long as anybody has studied homicide, this has been the pattern." (See the historical data.)
That pattern still holds true. FBI homicide data for 2018, the last year the bureau published a full crime report, show that the vast majority of murders were intraracial.
Blacks disproportionately killed by civilians, police
The Instagram post is correct to show that relatively few white Americans kill blacks. But what do homicide numbers look like when you account for population?
Data for the race of the victim and offender in homicides isn’t shown for every case in the FBI’s crime reports. It is shown only in the cases in which the race was known (some murders are never solved) and in cases involving a single victim and defendant.
Featured Fact-check
When looking at homicides as a whole, vblack people are disproportionately victims. In 2018, they made up 52% of homicide victims, despite making up about 12.7% of the population. White people made up about 43% of homicide victims despite making up 72% of the population.
The racial disparity is more stark for police shootings.
In 2013, the Black Lives Matter movement started in response to police killings of African Americans. The Washington Post’s database of police shootings shows that, since 2015, nearly twice as many white people have been shot and killed by police as black people.
However, the data comes with a big caveat: As with civilian homicides, black Americans are killed by police at a higher rate than white Americans.
"They account for less than 13 percent of the U.S. population, but are killed by police at more than twice the rate of white Americans," the Post reported. "Hispanic Americans are also killed by police at a disproportionate rate."
Our ruling
An Instagram post shows a bar graph comparing homicides for various racial groups.
The graph purports to draw from 2013 FBI crime data. It accurately shows that white-on-black murders were the rarest kind of homicide that year, but the graph misrepresents the relative frequency of white-on-white murders, which constituted the largest proportion of all homicides. Experts say most homicides are intraracial.
The Black Lives Matter movement started in response to police killings of black Americans. When accounting for population and homicides as a whole, blacks are killed by civilians and police at a higher rate than white Americans.
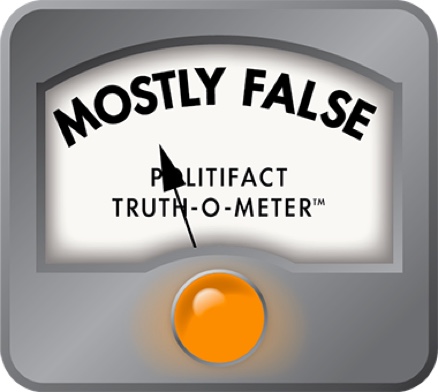
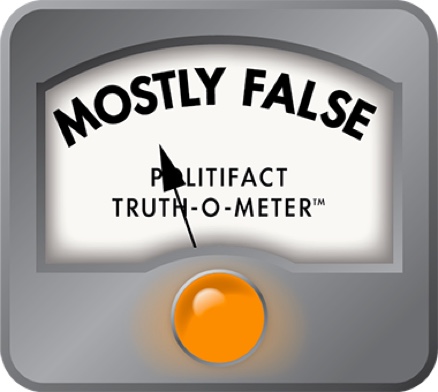
The Instagram post contains an element of truth but ignores critical facts that would give a different impression. We rate it Mostly False.
Our Sources
Black Lives Matter Global Network, About page, accessed June 18, 2020
Facebook post, June 7, 2020
Facebook post, June 7, 2020
FBI Uniform Crime Reporting Program, Murder Victims by Race, Ethnicity, and Sex, 2018
FBI Uniform Crime Reporting Program, Race, Ethnicity, and Sex of Victim by Race, Ethnicity, and Sex of Offender, 2013
FBI Uniform Crime Reporting Program, Race, Sex, and Ethnicity of Victim by Race, Sex, and Ethnicity of Offender, 2018
Instagram post, June 17, 2020
PolitiFact, "A look at statistics on black-on-black murders," July 17, 2013
PolitiFact, "TikTok video misleads on police shooting data," June 3, 2020
PolitiFact, "Trump's Pants on Fire tweet that blacks killed 81% of white homicide victims," Nov. 23, 2015
U.S. Census Bureau, 2018: ACS 1-Year Estimates Detailed Tables, Race
The Washington Post, Fatal Force, accessed June 18, 2020
Browse the Truth-O-Meter
More by Daniel Funke
Instagram graph misleads on the racial breakdown of homicides
Support independent fact-checking.
Become a member!
In a world of wild talk and fake news, help us stand up for the facts.


