
Our only agenda is to publish the truth so you can be an informed participant in democracy.
We need your help.


How bad was the economy under President Barack Obama? Pretty bad, argues former House Speaker Newt Gingrich, R-Ga.
In economic growth, "Obama's best year was slower than Bill Clinton's worst year," Gingrich told Fox News’ Maria Bartiromo on July 23, 2017. "That's astonishing."
We’ve previously looked at why it’s so hard these days for the United States to sustain 3 percent annual economic growth — a benchmark President Donald Trump says the country can again reach with his leadership.
But we wondered whether the difference in economic performance under the two most recent Democratic presidents was so stark.
We found that Gingrich’s talking point is correct, though he leaves out some important context.
Annual economic growth is typically measured by the change, up or down, in gross domestic product from year to year, after adjusting for inflation. This data is collected by the Bureau of Economic Analysis, a federal office.
As it turns out, Clinton had two years tied for last place -- 1993 and 1995. In both years, GDP grew by 2.7 percent.
As for Obama, his best annual showing came in 2015, with 2.6 percent.
In the following chart, the worst Clinton years and the best Obama year are marked in blue.
So by the primary measure, Gingrich’s statement is correct.
However, it’s worth noting that a related statistic shows the record on Obama’s watch in a somewhat more favorable light.
Gary Burtless, an economist at the Brookings Institution, said that GDP growth depends on two major factors -- how productive workers are, and how many workers there are. And Clinton was blessed with a worker population that was growing much faster than it later would under Obama.
When Clinton was president, Burtless said, the population between the ages of 15 and 64 increased by 1.2 percent a year. Under Obama, the increase was just 0.6 percent.
"So it seems to me a bit absurd to compare overall GDP growth in the two administrations without somehow accounting for the different rates of growth in the population," Burtless said.
It’s possible to use a variant on our previous metric — GDP growth per capita — that lessens this problem. Here’s what that measurement looks like:
Using this measurement, Obama exceeded Clinton’s worst annual performance during four years (2010, 2012, 2014, 2015).
In other words, while Clinton still did better overall when population growth is taken into account, the Obama administration had a better experience using this metric than is implied by Gingrich's statement, Burtless said.
Gingrich’s office did not reply to an inquiry.
Gingrich said that in economic growth, "Obama's best year was slower than Bill Clinton's worst year."
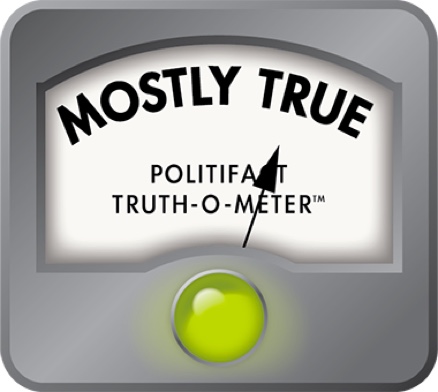
Measured by the annual change in inflation-adjusted GDP -- the typical measurement -- Gingrich is correct. But it’s worth noting that if you strip out the impact of population growth, the Clinton-Obama comparison is more mixed. We rate the statement Mostly True.
Newt Gingrich, remarks on Fox News, July 23, 2017
Bureau of Economic Analysis, interactive data tables, accessed July 23, 2017
Federal Reserve Bank of St. Louis, real gross domestic product per capita, accessed July 23, 2017
PolitiFact, "Why economists are skeptical that U.S. can grow by 3 percent," May 26, 2017
Email interview with Gary Burtless, senior fellow at the Brookings Institution, July 23, 2017
In a world of wild talk and fake news, help us stand up for the facts.